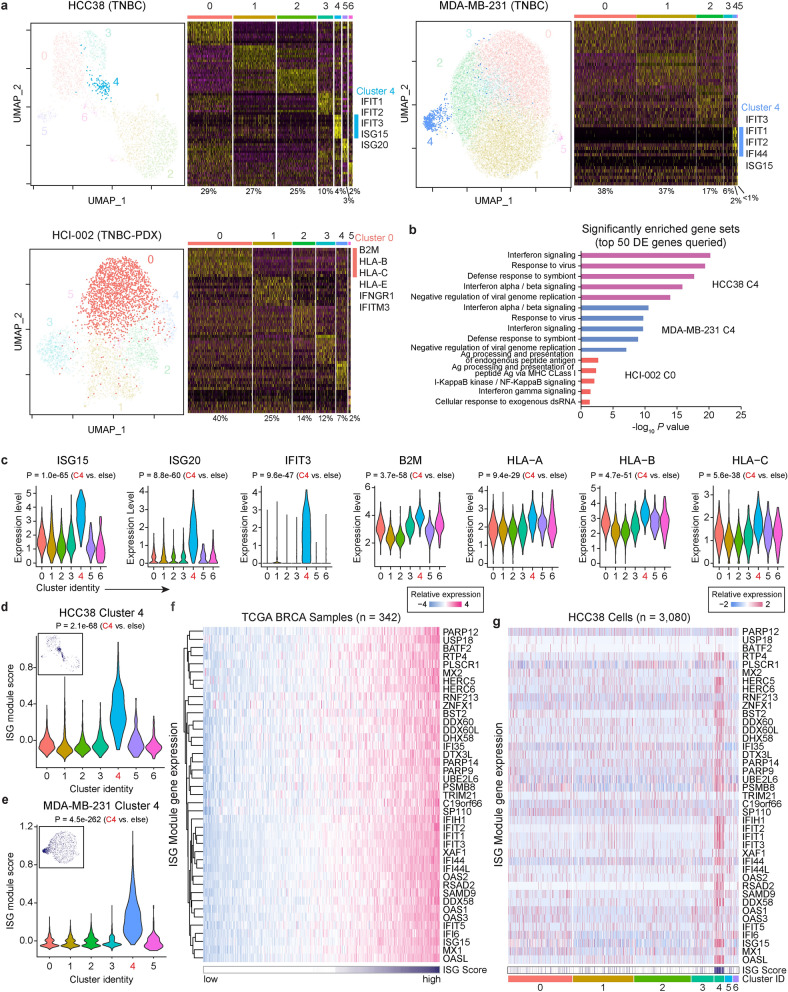
Figure 2.
A subpopulation of inflamed cells is recurrent in TNBCs. (a) UMAP plots for cells from two TNBC cell lines (HCC38, MDA-MB-231) and a patient-derived xenograft model of TNBC (HCI-002) with optimized Louvain clustering shown and highlighting clusters enriched for ISG genes. Heatmaps displaying scaled expression patterns of top marker genes within each cluster shown to the right with high expression in yellow and low expression in purple. Percentage of total cells contained in each cluster is listed, and inflamed clusters highlighted with accompanying top differentially expressed genes. (b) Top significantly enriched gene sets identified from a Gene Set Enrichment Analysis (GSEA) of the 50 most differentially expressed (DE) genes from HCC38 Cluster 4, MDA-MB-231 Cluster 4, and HCI-002 Cluster 0 cells. (c) Expression levels of known interferon-stimulated genes for individual HCC38 cells in each cluster. (d,e) Relative ISG module scores for individual (d) HCC38 and (e) MDA-MB-231 cells in each cluster. Insert shows ISG module expression for individual cells mapped onto a UMAP plot. (f) Relative mRNA expression levels for ISG module genes across the breast cancer TCGA cohort. Samples sorted based on ISG module score. (g) Relative expression levels for ISG module genes across individual HCC38 cells. Cells are arranged based on cluster identity and annotated for ISG module score (white indicates low, and purple indicates high). In all graphs P values are calculated using a two-sided Wilcoxon test unless indicated otherwise. ISG interferon stimulated genes.

