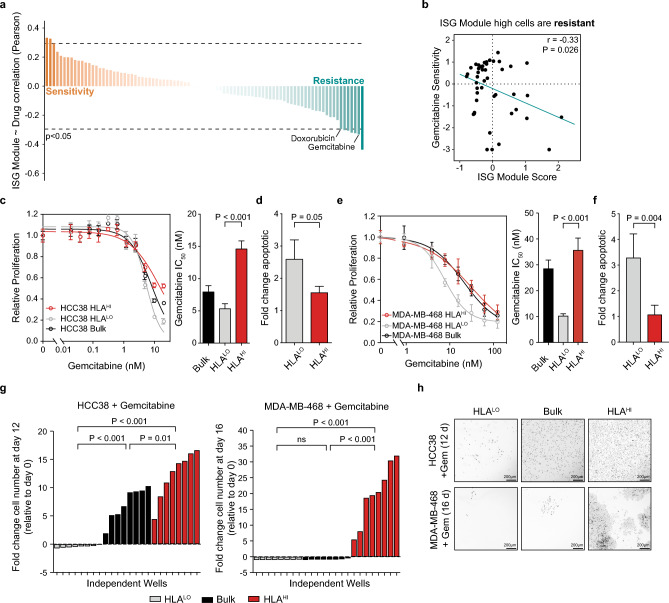
Figure 4.
TNBC cells in the inflamed state are chemoresistant. (a) ISG module scores from a panel of 84 breast cancer cell lines were correlated with drug sensitivity values across 90 compounds. Sorted Pearson correlation values shown with a cutoff for significant (p = 0.05) correlations indicated by a dashed line. (b) Scatter plot of ISG module scores in breast cancer cell lines compared with their sensitivity (normalized –log of IC50) to gemcitabine. P value based on Pearson correlation. (c) Proliferation of HCC38 HLAHI (top 5%), HLALO (bottom 10%), and bulk population in response to 72 h gemcitabine treatment compared to DMSO control. IC50 quantification of dose–response curves shown to the right. (d) Fold change in apoptotic cells in HCC38 HLA subpopulations after 72 h treatment with the IC50 dose (5 nM) of gemcitabine normalized to DMSO control. (e) Proliferation of MDA-MB-468 HLAHI, HLALO and bulk populations in response to 72 h gemcitabine treatment compared to DMSO control. IC50 quantification of dose–response curves shown to the right. (f) Fold change in apoptotic cells in MDA-MB-468 HLA subpopulations after 72 h treatment with the IC50 dose (7.8 nM) of gemcitabine normalized to DMSO control. (g) Fold change in the number of cells remaining for HCC38(left) and MDA-MB-468 (right) samples treated for the indicated time period with 2.5 nM or 11 nM gemcitabine relative to day 0 calculated for n = 8 independent samples. For comparison, the mean day 0 cell count from n = 4 independent samples was used. (h) Representative images of colony formation assay for HCC38 (top) and MDA-MB-468 (top) HLALO (left), bulk (middle), and HLAHI (right) cells following chemotherapy treatment. Cells were stained with Hoechst 33,342 and fluorescent image inverted for clarity. Scale bar, 200 µm. For (c–f), data represents n = 4 biologically independent samples. Error bars are mean ± s.d., and P values calculated using a two-sided t-test except for (g) in which a two-sided t-test with Welch’s correction was used.

