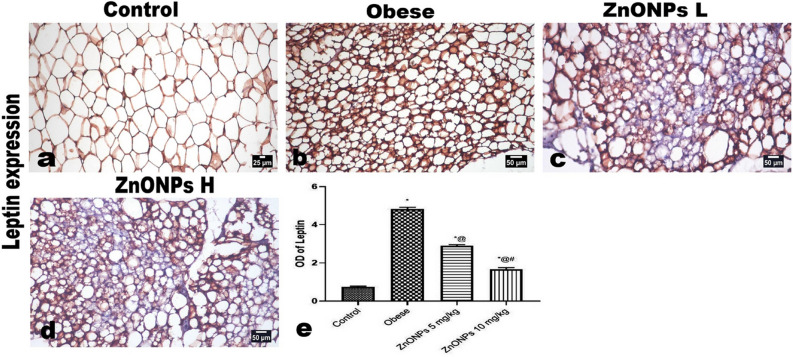
Figure 12.
Photomicrographs of the immunohistochemical expression of leptin in periaortic fat showing: (a) positively stained thin rim of adipocytes’ cytoplasm. intense expression of leptin in various types of adipocytes, marked decreased leptin expression in ZnONPs treated groups. The positive brown color is quantified as optical density by image analysis software. Each bar represents the mean ± SE of 8 rats. *vs normal control group, @vs obese group, #vs ZnONPs (5 mg/kg) at p < 0.05. ZnONPs: Zinc oxide nanoparticle.

