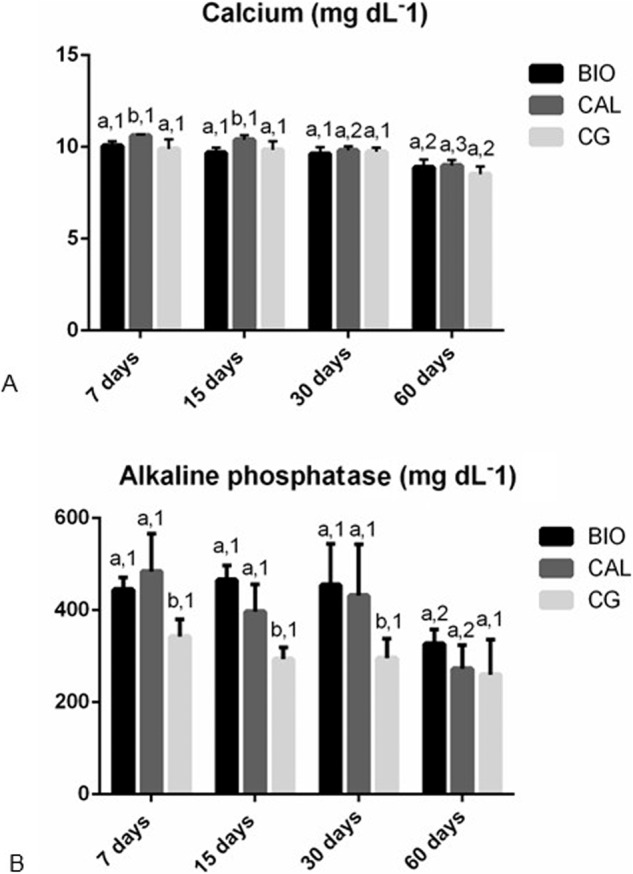
Fig. 1.

Graphics showing the values (expressed as mean ± standard deviation) of the concentration of calcium (A), and alkaline phosphatase (B) in the serum of the Bio-C Temp (BIO), Calen (CAL) and CG specimens at 7, 15, 30 and 60 days. In each period, the comparison among the groups is indicated by superscript letters; different letters = significant difference. The superscript numbers indicate the analysis of each group over time; different numbers = significant difference. Tukey’s test (p ≤ 0.05)
