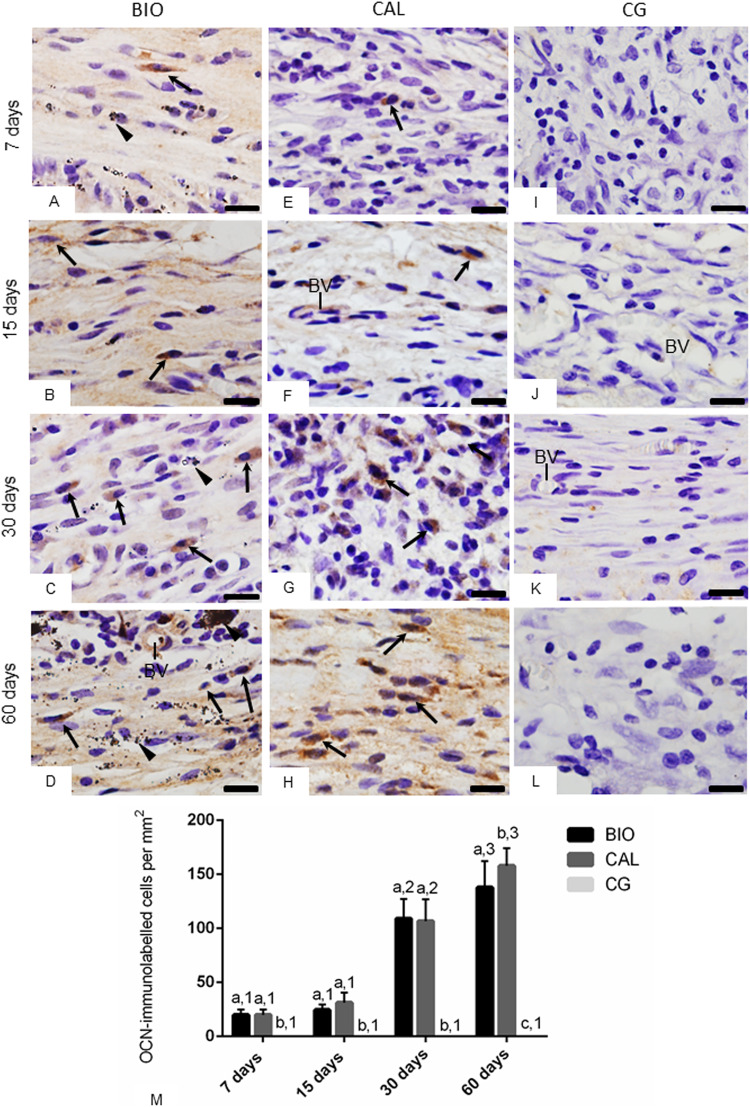
Fig. 3.
A–L Photomicrographs showing portions of sections submitted to immunohistochemistry for detection of OCN (in brown colour) and counterstained with haematoxylin. In BIO (A–D) and CAL (E–H) some elliptical and/or fusiform cells exhibit immunolabelling in their cytoplasm (arrows). None immunolabelled cell is observed in the CG specimens (I–L). Arrowhead: material particles; BV, blood vessels. Bars: 18 μm. Figure 3M—Graphic showing the number of OCN-immunolabelled cells per mm2 (expressed as mean ± standard deviation) from BIO, CAL and CG groups at 7, 15, 30 and 60 days. In each period, the comparison among the groups is indicated by superscript letters; different letters = significant difference. The superscript numbers indicate the analysis of each group over time; different numbers = significant difference. Tukey’s test (p ≤ 0.05)

