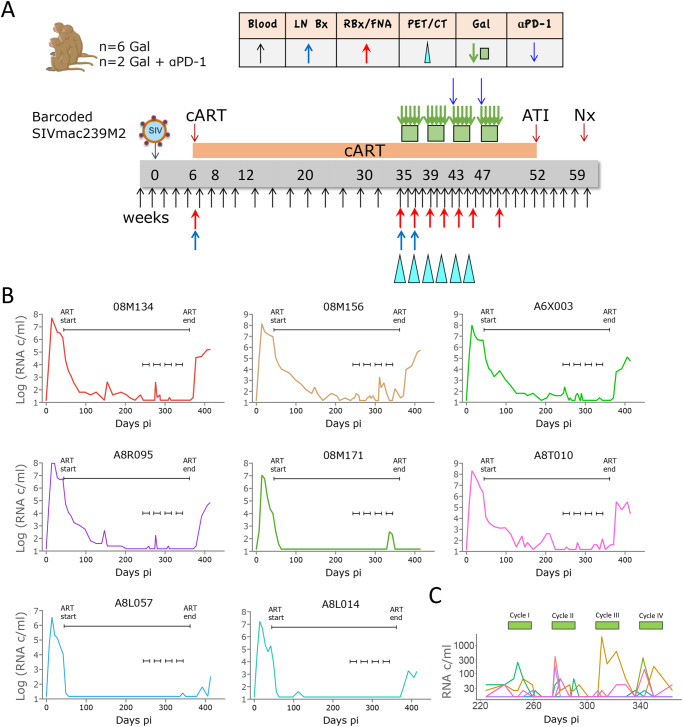
Fig. 1. Four 2-weeks cycles with galunisertib lead to viral reactivation in blood.
A Schematic representation of the study and sampling schedule. B Plasma VL in blood for each macaque throughout the study. The longer black line indicates the period on ART, while the 4 small black lines indicate the start and end of each galunisertib cycle. C Enlarged plasma VL for all macaques during galunisertib therapy. Green bars indicate galunisertib cycles. Source data are provided as a Source Data file. Image from BioRender.

