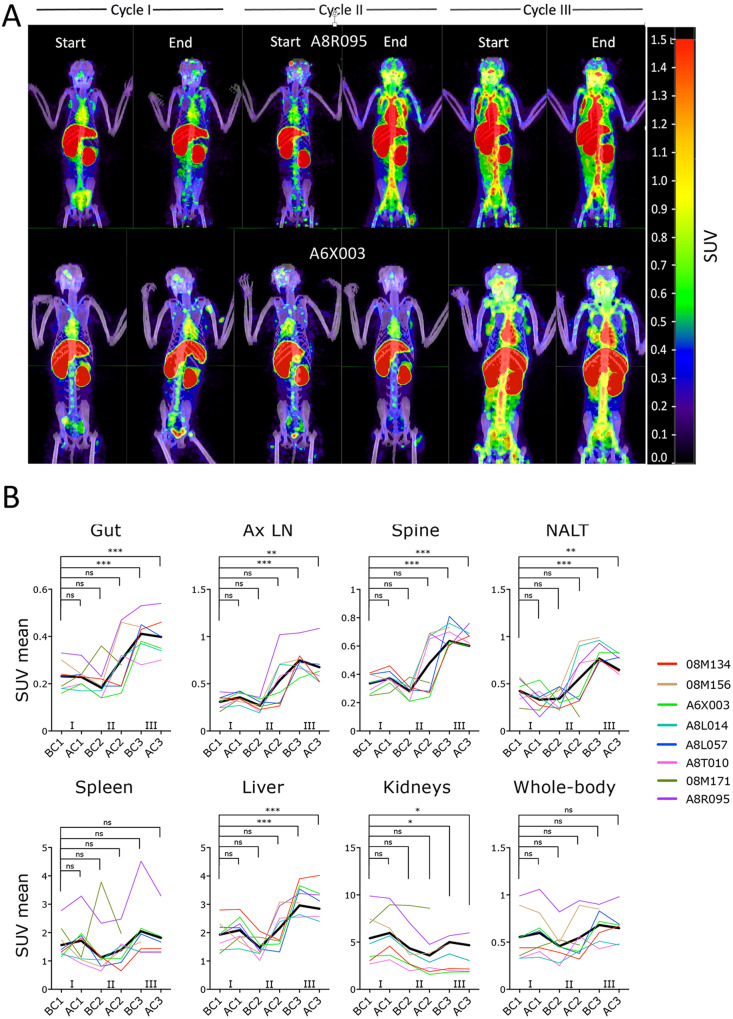
Fig. 2. Galunisertib leads to viral reactivation in tissues.
A The 64Cu-DOTA-Fab2(7D3) probe was injected ~24 h before PET/CT scan before and at the end of each of the first 3 galunisertib cycles. Representative images from the maximum intensity projections (MIP) of fused PET and CT scans are shown for a macaque with a major increase at the end of cycle 2 and one showing increase at the beginning of cycle 3. MIPs were generated using the MIM software, set to a numerical scale of 0–1.5 SUVbw, and visualized with the Rainbow color scale. B Mean SUV were calculated for each anatomical area, and values were analyzed with mixed-effect analysis. Data from the scans performed at the last 2 time points (BC3 and AC3) in 08M171 were excluded because of technical issues with the probe. Thicker black line represents the mean. P-values were calculated for comparison of each time point with the before cycle 1 time point (BC1; AC1= after cycle 1, BC2= before cycle 2; AC2= after cycle 2; BC3= before cycle 3; AC3= after cycle 3; Holm-Sidak multiple comparison correction; *p ≤ 0.05 **p ≤ 0.01 ***p ≤ 0.01). Source data are provided as a Source Data file.

