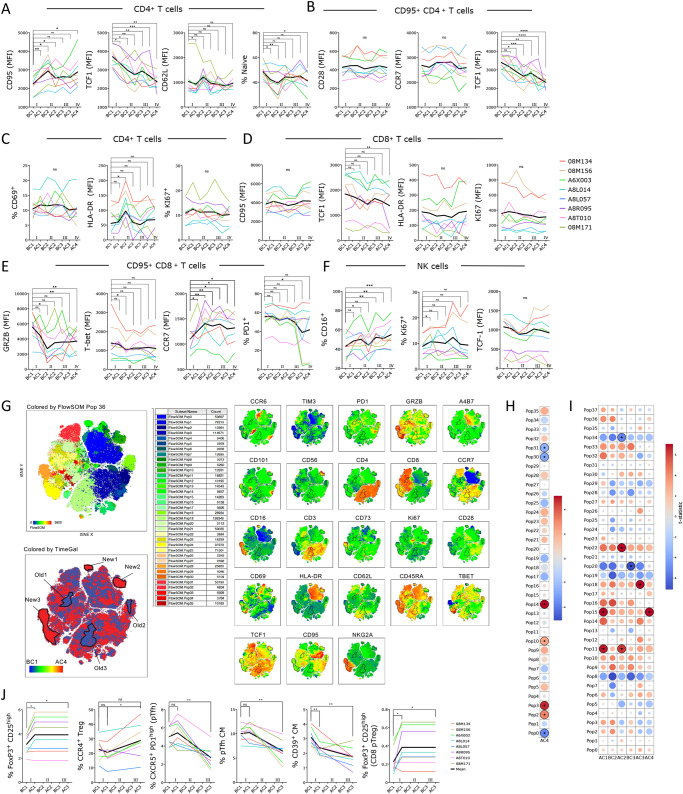
Fig. 4. Galunisertib leads toward effector in T and NK cells, increasing Treg and decreasing Tfh frequencies.
A–F Geometric mean fluorescent intensities (MFI) of each marker and frequency of indicated subset within live, singlets CD3+ CD4+ T cells (A and C) or CD3+ CD4+ CD95+ T cells (B) or CD8+ or CD8+ CD95+ T cells or NK cells (NKG2A+ CD8+ CD3− cells) are shown. Thick black line represents the mean. Changes from baseline (beginning of cycle 1, BC1) are shown for graphs with at least 1 significant difference (Repeated measures ANOVA with Holm-Sidak correction for multiple comparisons; *p ≤ 0.05 **p ≤ 0.01 ***p ≤ 0.01). G tSNE of lymphocyte, live, singlets events after normalization for BC1 and AC4 (all 8 macaques) with FlowSOM 36 clusters overlaid on tSNE (top left) or heatmap of each markers MFI (right) or heatmap of time point (blue is BC1 and red is AC4; bottom left) is shown. 6 populations were manually gated on red or blue areas (red, New1-3 and blue Old1-3). H Bubble chart displaying changes in AC4 from BC1 in populations (FlowSOM clusters) characterized by markers MFI in Supplementary Fig. S8A. Color is proportional to the effect size and size to p-value (Wilcoxon sum rank non-parameter two-tailed test). I Bubble chart displaying changes from BC1 at all time points in populations (FlowSOM clusters) characterized in Supplementary Fig. S8C (ANOVA repeated measures with Holm-Sidak multiple comparisons correction; *p ≤ 0.05 **p ≤ 0.01 ***p ≤ 0.01). J Frequency of indicated subset within live, singlets CD3+ CD4+ T or CD3+ CD4+ CD95+ CD28+ T cells (CM = central memory) or within CD3+ CD8+ T cells. Changes from baseline (BC1) are shown (ANOVA repeated measures with Holm-Sidak correction for multiple comparisons; *p ≤ 0.05 **p ≤ 0.01 ***p ≤ 0.01). Source data are provided as a Source Data file.

