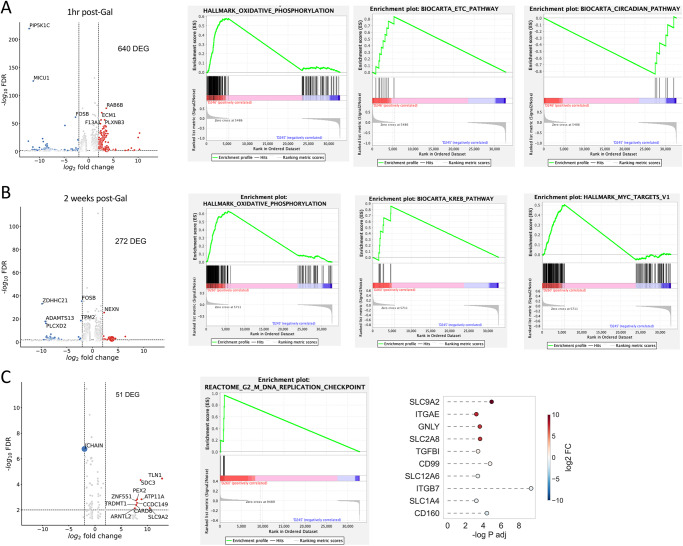
Fig. 5. OXPHOS and other metabolic pathways increase rapidly with TGF-β blockade.
Bulk RNAseq was performed with PBMC from before cycle 1 (24 h) and 1hrs after the first dose of galunisertib (A) or after the last dose of cycle 1 (B) and with rectal biopsies collected before cycle 1 (24 h) and after the last dose of cycle 1 (C). The number of differentially expressed genes (DEG) obtained by DESeq2 with an FDR < 0.05 and abs(log2FC)>2 are shown in each respective volcano plot. Enrichment plots are shown after GSEA (with all FDR < 0.05 DEGs) for significantly enriched pathways (top 1 or 2 pathway by ES). C Lollipop graph of selected DEG of interest among significantly different genes (FDR < 0.05). Source data are provided as a Source Data file.

