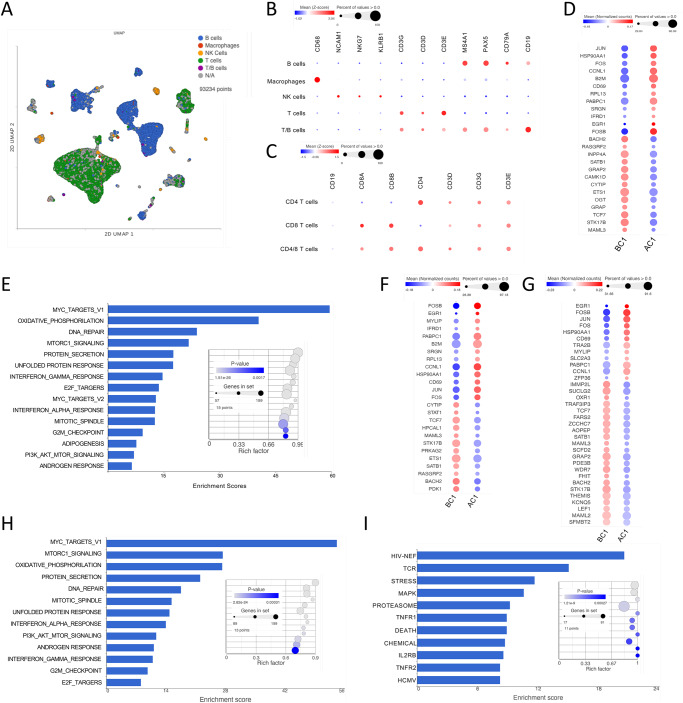
Fig. 6. scRNAseq of lymph node before and after cycle 1 confirms a switch toward effector and increased metabolism in all immune subsets with galunisertib.
A UMAP projection of 93234 cells from lymph nodes collected right before and at the end of cycle 1 from all 8 macaques (16 samples). Gene-based classification of major immune subset is overlaid on UMAP. In gray are unclassified cells. Bubble plots showing expression (mean normalized counts proportional to the color; size proportional to the percentage of cells) of each marker listed in each cell subset. Marker listed are those used for classification of major immune subsets (B) or CD4+ and CD8+ T cells (C). D Significantly different genes obtained by Hurdle model (FDR < 0.05; log2FC = 0.15) in the T cell subset are shown with color proportional to normalized counts. E Significantly enriched pathways (FDR < 0.01) in T cells DEGs within the hallmark collection. Significantly different genes (FDR < 0.05; log2FC = 0.15) in the CD4+ (F) and CD8+ (G) T cell subset. Significantly enriched pathways (FDR < 0.01) in CD4+ T cells DEGs within the hallmark (H) and biocarta (I) collections. Source data are provided as a Source Data file.

