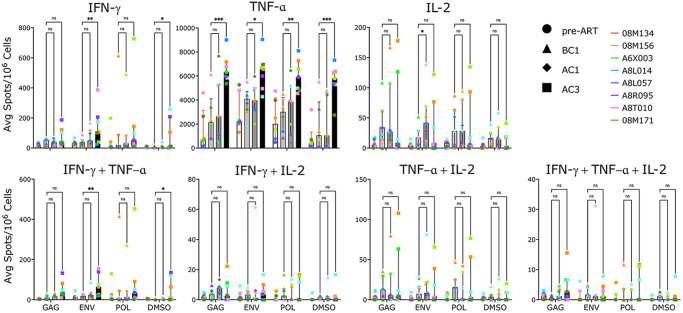
Fig. 7. Galunisertib increases SIV-specific responses.
Average spots (from triplicates) per 106 PBMC at the time of ART initiation (pre-ART), before cycle 1 (BC1), after cycle 1 (AC1) and at the end of cycle 3 (AC3) with galunisertib after 24hrs ex vivo stimulation with 15-mer peptides (gag, env, pol) or mock (DMSO). Each post-galunisertib time point was compared to BC1 (Mixed effect analysis adjusted for multiple comparisons with Dunnet post-hoc p-values are shown; *p ≤ 0.05 **p ≤ 0.01 ***p ≤ 0.001). Bars represent the median with interquartile range as error bars. Source data are provided as a Source Data file.

