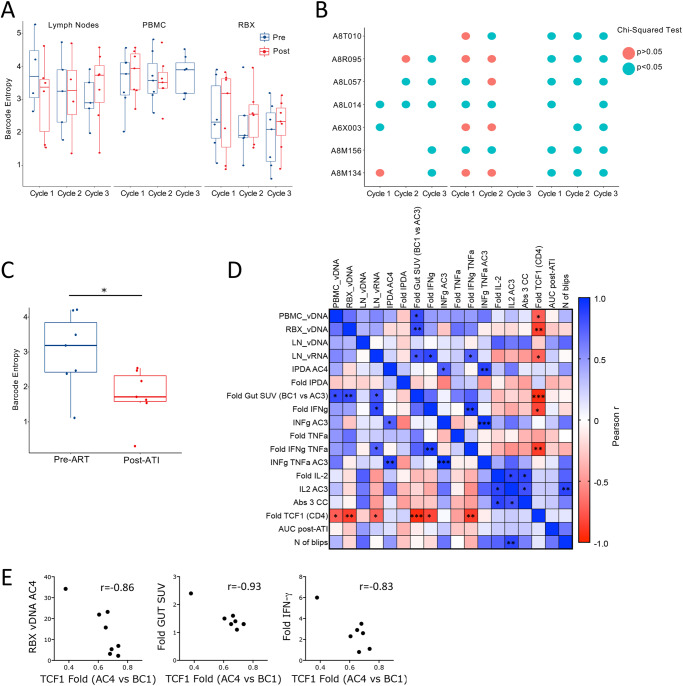
Fig. 8. TCF1 decrease associates with virological and immunological endpoints.
A Barcode diversity measure as Shannon Entropy is shown before and after each of the first 3 galunisertib cycles for LN, PBMC and colorectal biopsies. Box-and-whisker plot represents the median +/− the interquartile range of data from 4 to 8 macaques (all data from macaques with detectable barcodes were included at each time point for a given tissue; no significant differences using linear mixed effects models). Blue= before; Red= end of each cycle. B Bubble plot shows the results of statistical testing (Chi-squared) for differences in frequency distribution of barcodes before compared to after, for each of the first 3 cycles of galunisertib for each macaque in the indicated tissues. Blue indicates significant differences p ≤ 0.05. C Barcode entropy of virus isolated at the time of ART initiation compared to week 6 post-ATI in plasma (Wilcoxon matched pairs two-tailed test; *p ≤ 0.05). D Correlation matrix of several key variables of virological or immunological effect of galunisertib. Color is proportional to Pearson r coefficient. *p ≤ 0.05 **p ≤ 0.01 ***p ≤ 0.001 indicate significant correlations. E Association between fold increase in TCF1 (MFI) from BC1 to AC4 with CA-vDNA levels at AC4, change in gut SUV at AC3 compared to BC1 and fold increase in IFN-γ (AC3 vs BC1). Person r is shown. All correlations have *p ≤ 0.05. Source data are provided as a Source Data file.

