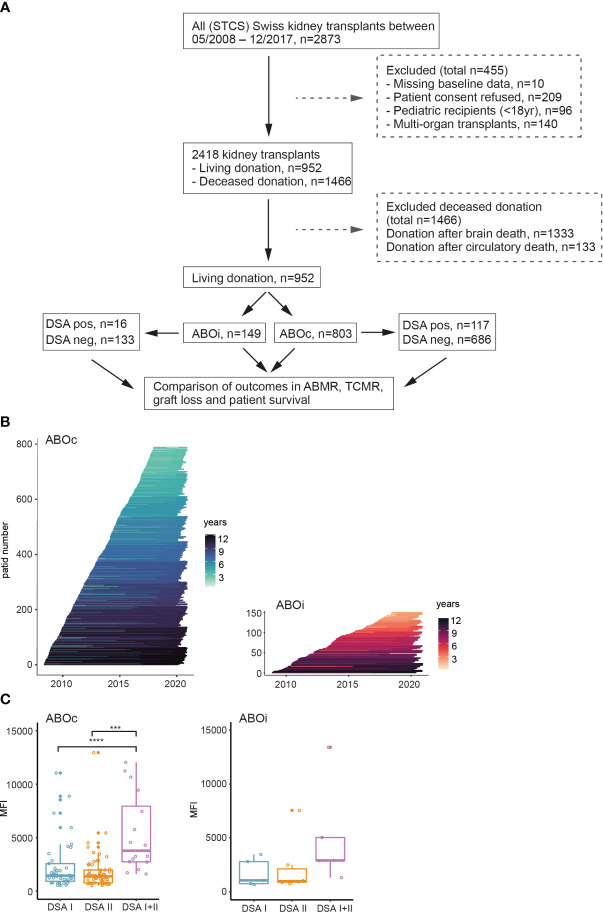
Figure 1.
Overview of the ABO study group nested within the STCS cohort. (A) Flowchart overview of patient inclusion into the study. (B) Follow-up time of each individual patient in the ABOc and ABOi groups. (C) Summary of the cumulative DSA MFI in the respective groups. One-way ANOVA analysis with Tukey’s multiple comparisons as a post hoc test was used for (C) to assess p values; ***p<0.001, ****p<0.0001.

