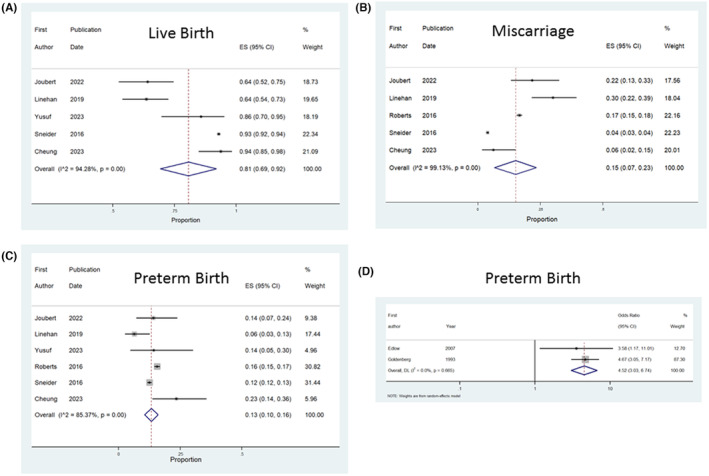
FIGURE 3.

Forest plots showing the results of meta‐analysis as follows. (A) proportion of live births in subsequent pregnancy in cohort studies, (B) proportion of miscarriages in subsequent pregnancy in cohort studies, (C) proportion of preterm births in subsequent pregnancy in cohort studies and (D) odds of preterm birth in subsequent pregnancy in case control studies.
