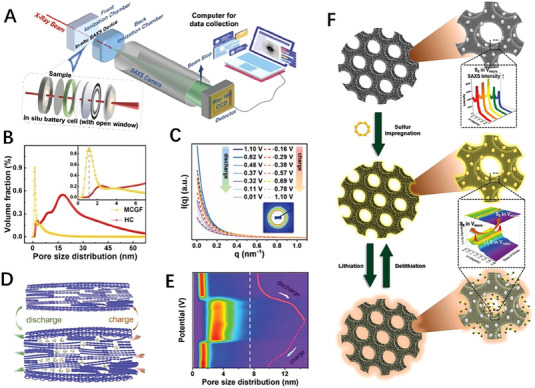
FIGURE 4.

In situ small‐angle X‐ray scattering technique reveals the nanoscale size distribution. (A) Schematic diagram of the in situ SAXS during the electrochemical process. (B) Pore size distribution calculated by TBT method. (C) In situ curves of MCGF during the electrochemical process. (D) Schematic diagram of Na+ adsorption and desorption in the MCGF under electrochemical reaction. (E) Pore size distribution based on in‐situ SAXS data. Reproduced with permission.[ 19 ] Copyright 2022, Wiley. (F) Schematic of S movement in OMC upon sulfur impregnation to lithiation and delithiation. Reproduced with permission.[ 103 ] Copyright 2021, The Royal Society of Chemistry.
