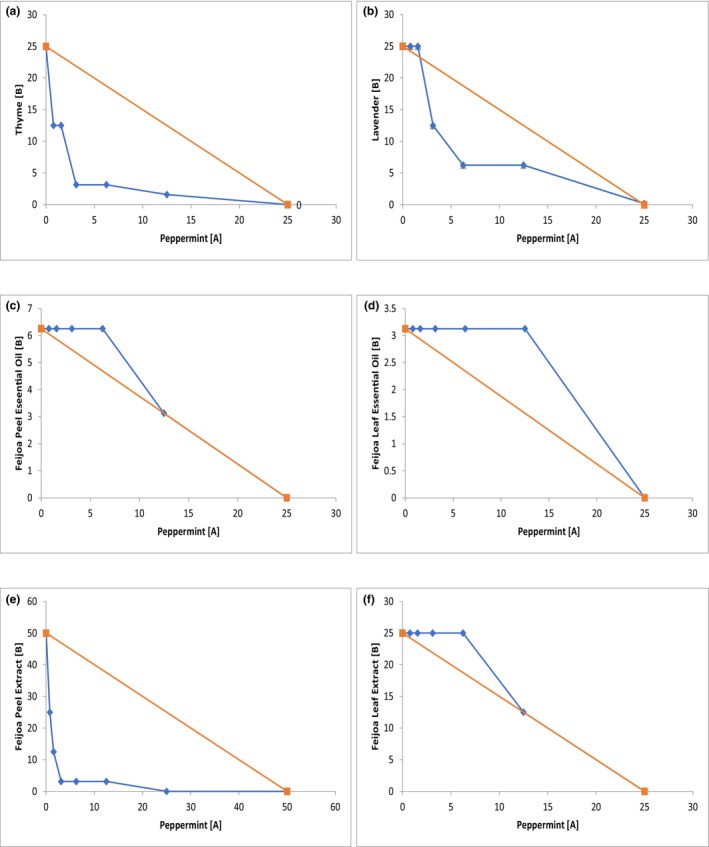
FIGURE 2.

Isobolograms of selected combinations of EO and extracts against L. monocytogenes. The FBC values on the X and Y axes are represented in mg/mL. FBC values of compound A and compound B (blue) are shown with the theoretical line (orange) for an additive interaction. Compound A is Peppermint EO, and Compound B is Thyme EO (a); Lavender EO (b); Feijoa Peel EO (c); Feijoa Leaf EO (d); Feijoa Peel Extract (e); and Feijoa Leaf Extract (f) (Key:  : FBC values of compound A and compound B;
  : Additive line).
