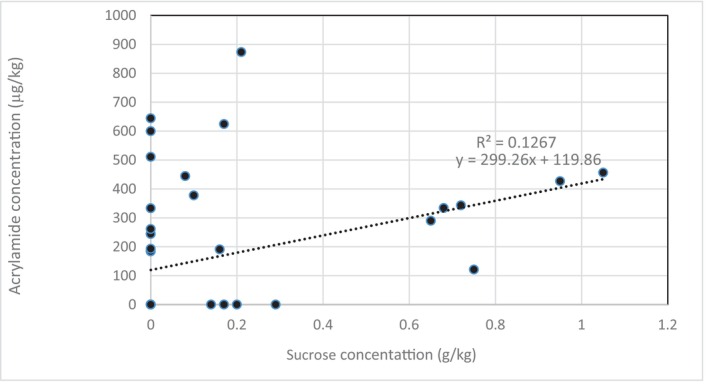
FIGURE 1.

Scatter plot of correlation between acrylamide and sucrose concentration in all potato samples. The dotted line presents the trend line showing a positive and significant association between acrylamide and sucrose, as depicted by the following equation: y = 299.26x + 119.86; R 2 change = 12.67%. This means that sucrose explains about 13% of the change in acrylamide concentration.
