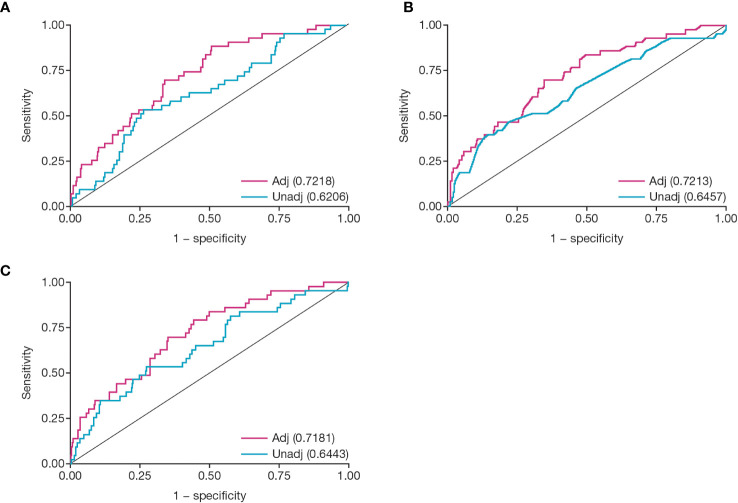
Figure 6.
Receiver operator characteristic analysis for CMV viral load kinetics. Figures show ROC analysis of: (A) peak viral load, (B) duration of viremia in weeks, and (C) viral load over time (AUC). Numbers given in parentheses are area under the unadjusted or adjusted ROC curve. Covariates for each adjusted model were delayed graft function, Induction ATG, and CMV D/R status at transplant. Adj, adjusted; ATG, antithymocyte globulin; AUC, area under the curve; CMV, cytomegalovirus; D/R, donor/recipient; ROC, receiver operator characteristic; unadj, unadjusted.

