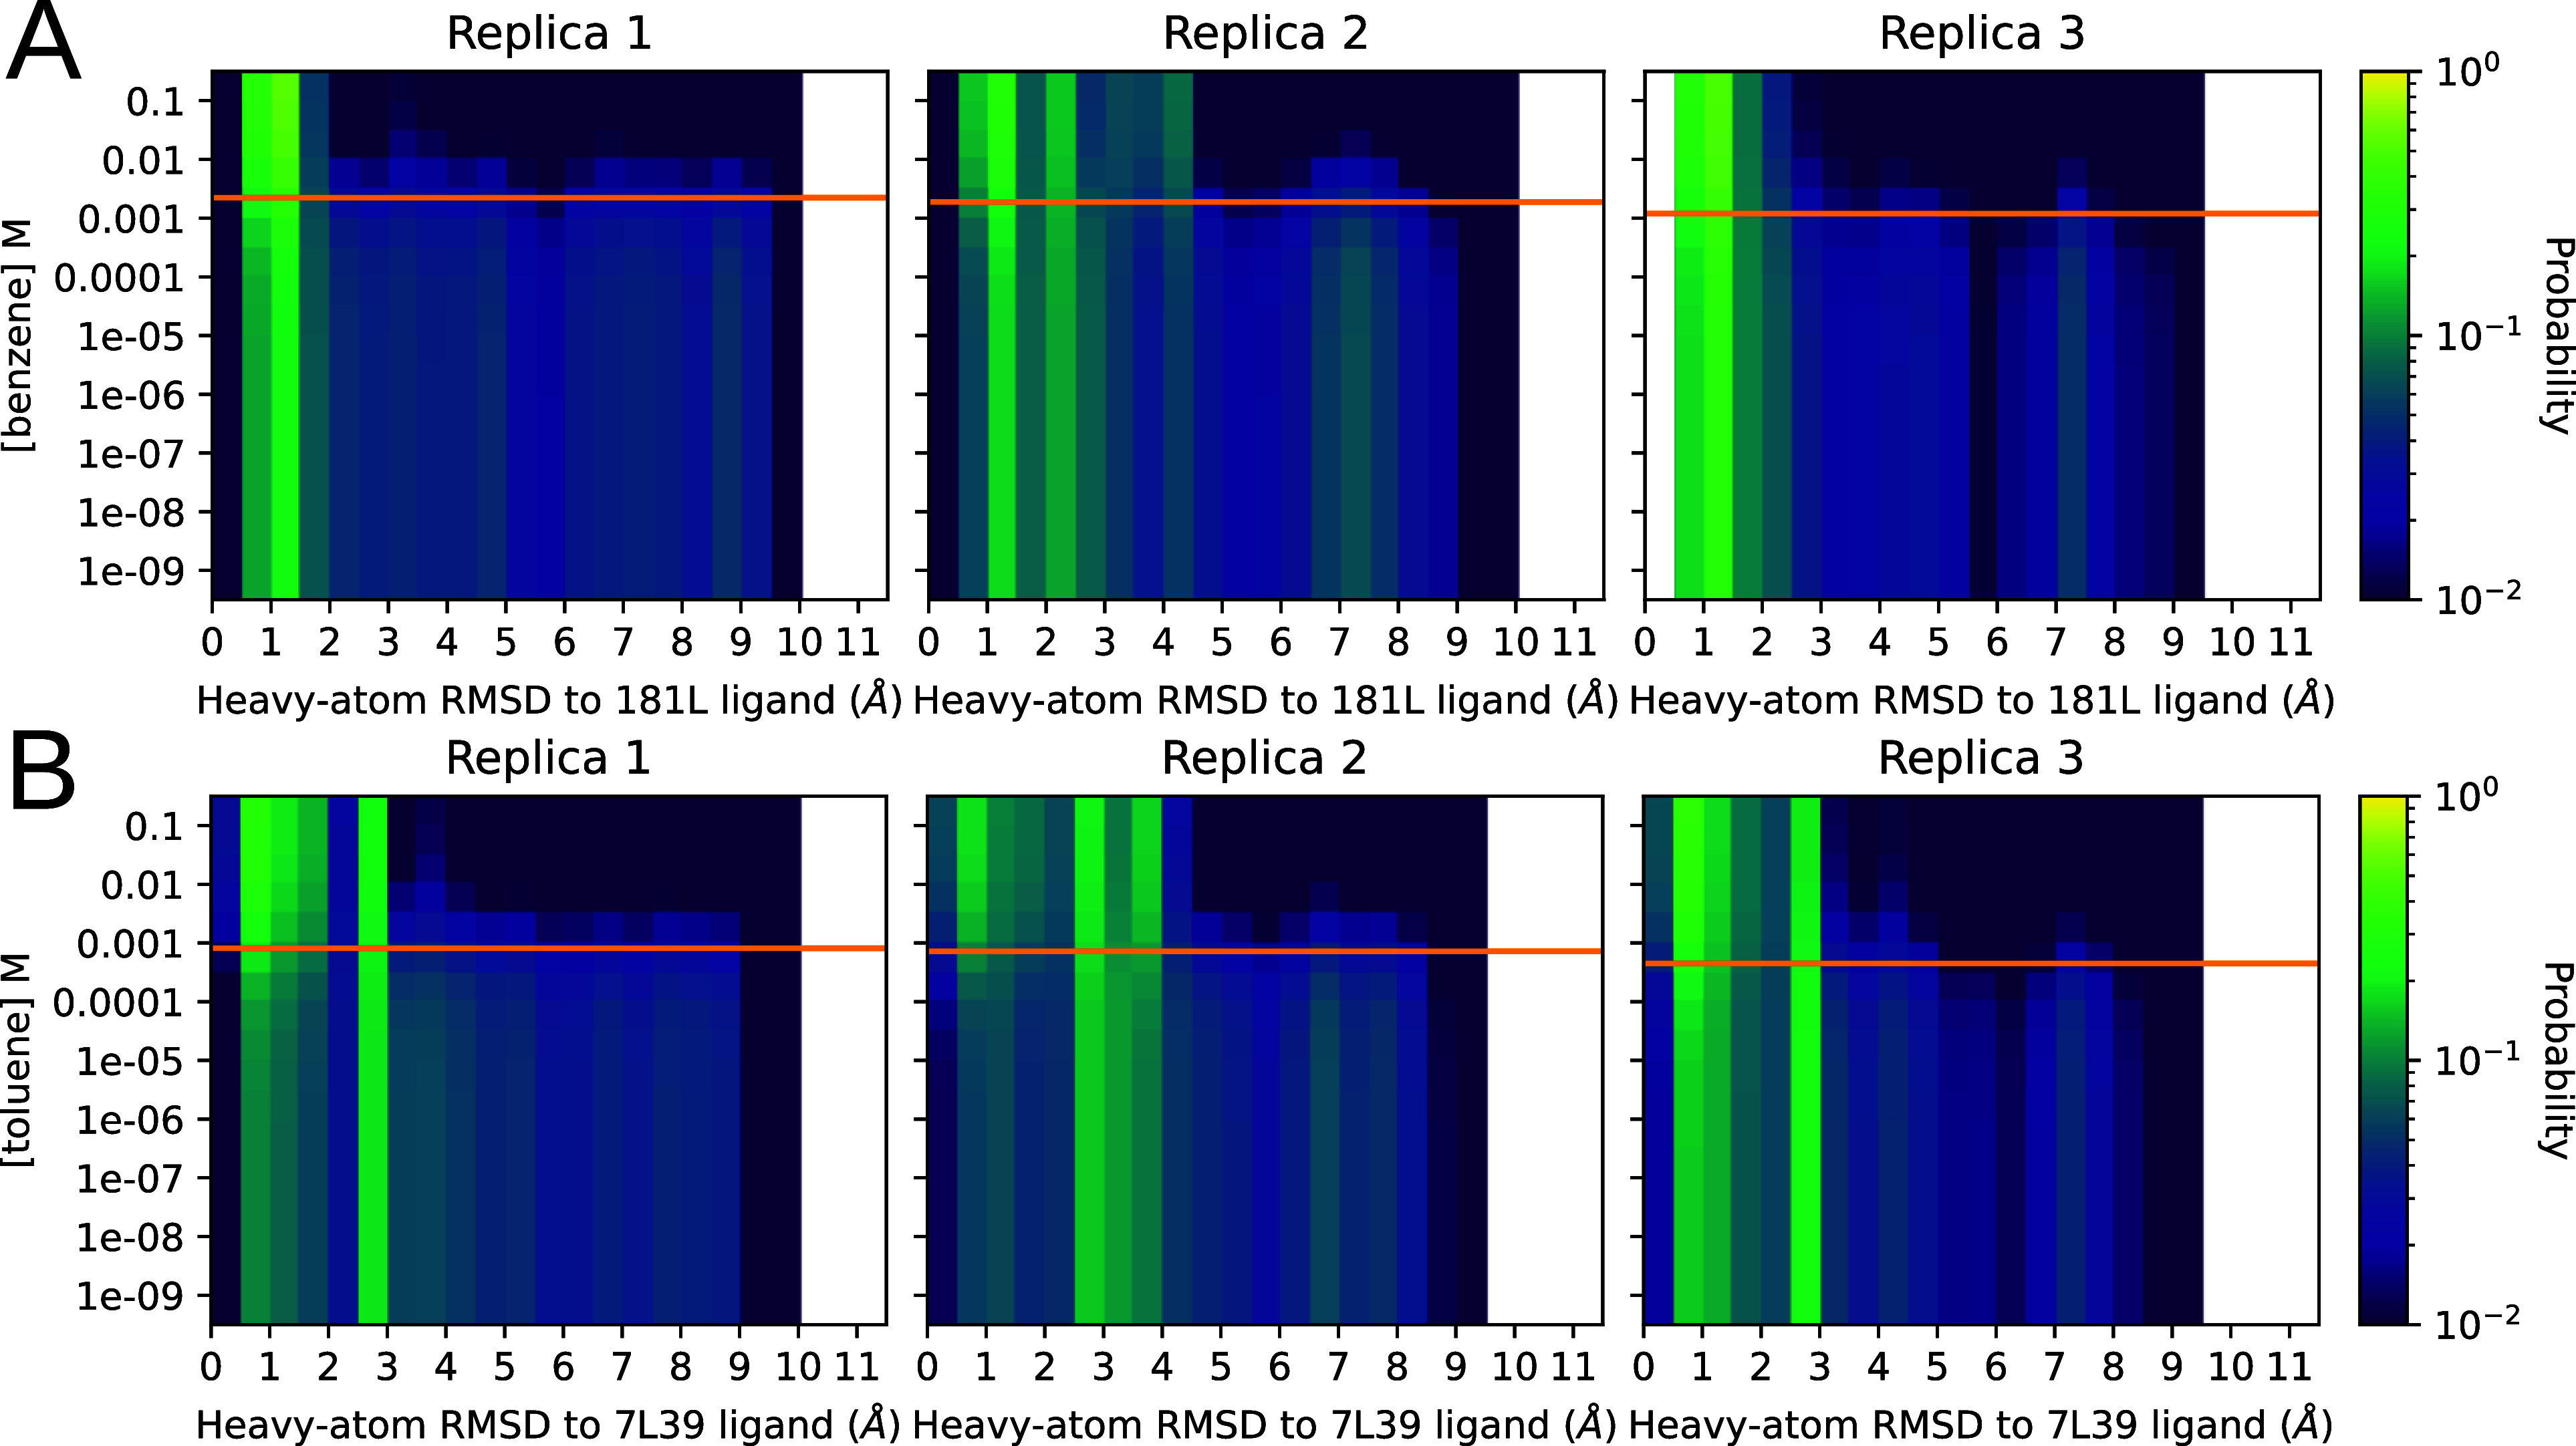
Figure 8.

Distribution of RMSDs to a ligand-bound reference structure as the concentration of the ligand is varied. Panels A and B represent the titrations for benzene and toluene, respectively. The Y axis is ligand concentration, and the X axis is the pocket-aligned symmetry corrected35 Ligand RMSD to holo crystal structure, histogrammed as before (Figure 4) . Each row in each heatmap is from the same raw data being histogrammed with different weights, computed by plugging the Y-value matching that row into eq 5. The orange line on each replica plot shows the KD as calculated for that replica using eq 1 for reference. The heat, or intensity, is in logscale to aid visualization. The top row in each heatmap is holo-like, because it is at high ligand concentration, and the bottom row is apolike, because it is at low ligand concentration. Being able to titrate observables measurable from conformations in this way could provide exciting opportunities to understand ligand efficacy in systems with allosteric behavior.
