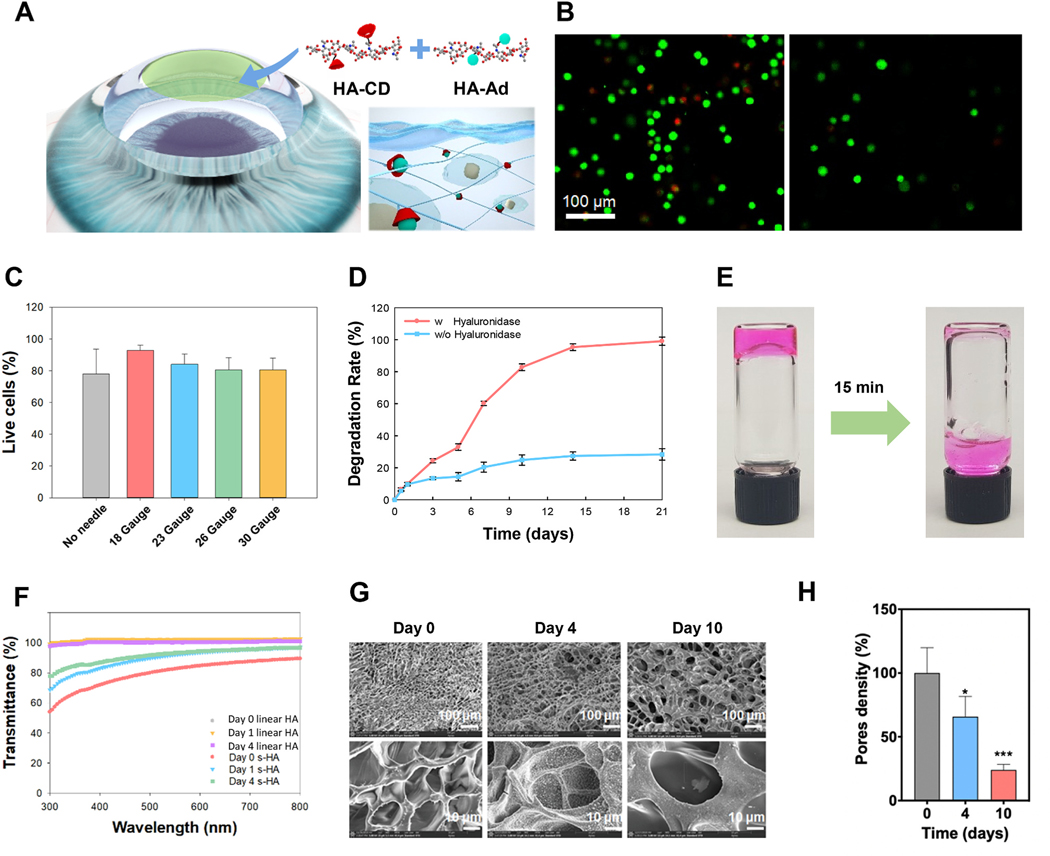
Fig. 1. Biophysical properties of supramolecular HA (s-HA) hydrogel.
(A) Schematic illustration of the cornea after application of the s-HA hydrogel. (B) Cell viability of CECs live in green and dead in red encapsulated in s-HA hydrogel without and after passing through a needle (scale bar: 100 μm). (C) Quantification of live/dead staining indicates high viability after injection through 18, 20, 23, 26, and 30 gauge needles (n =3). (D) Quantification of the degradation rate of s-HA hydrogel with and without hyaluronidase (n =3). (E) s-HA hydrogel stained with a magenta dye 1) before and 2) after degradation by the addition of excess CD. (F) Transmittance profile of s-HA hydrogel and linear HA viscoelastic solution at days 0, 1, and 4. (G) SEM images of s-HA hydrogel at days 0, 4, and 10 show an increase in pore size over time. (H) Quantification for the pore density change at day 4 * p = 0.0184 vs. day 0; and day 10 ***p < 0.0001 vs. day 0 (n =4). Ordinary one-way ANOVA (p < 0.005) was used to detect statistical differences followed by Dunnett’s multiple comparisons test.

