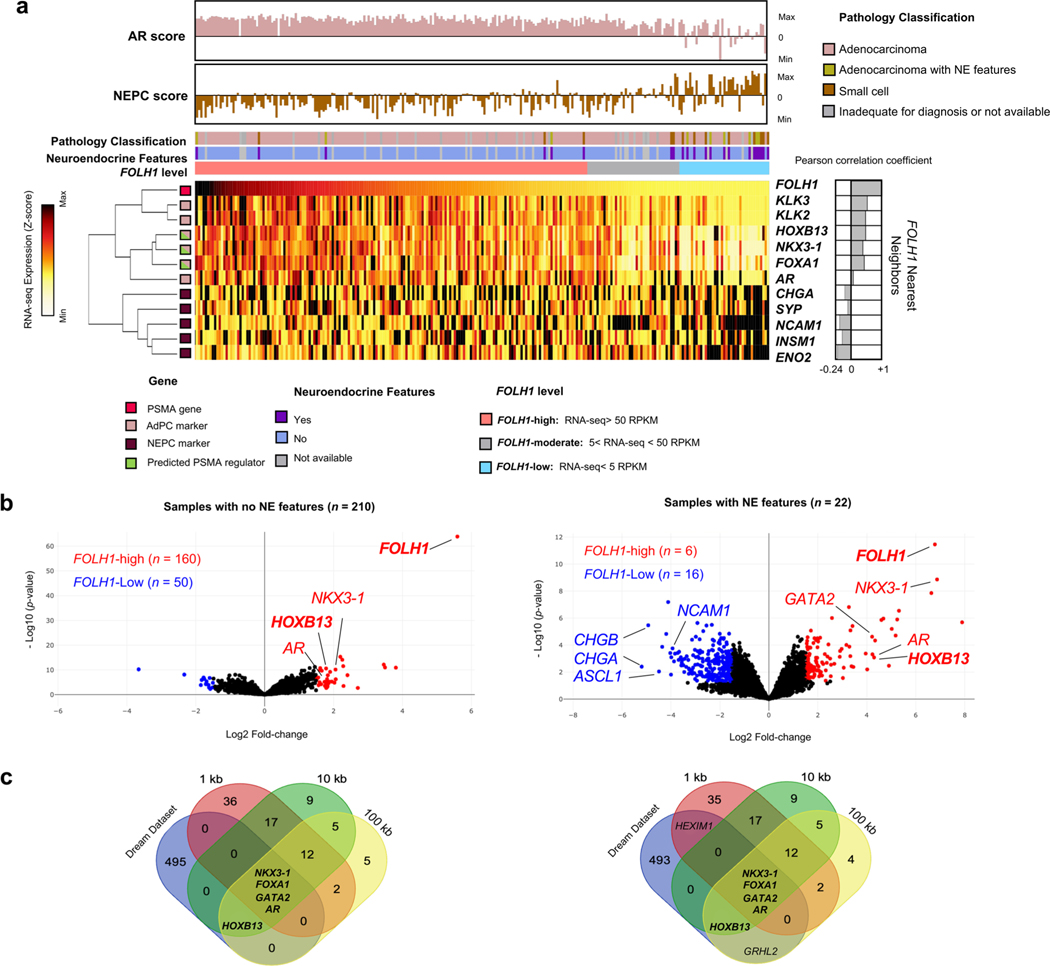
Extended Data Fig. 5 |. Estimation of FOLH1-positive regulators among CRPC tumors with and without neuroendocrine (NE) features.
a, Heat map of the expression levels of PSMA gene (FOLH1), AR-markers, NE markers and projected PSMA regulators in metastatic CRPC samples from the International SU2C/PCF Dream Team dataset 13 (N = 224 tumors) a, Expression levels of FOLH1 in prostate tissue during progression from benign to NEPC. b, Volcano plot of DGE analysis in FOLH1-high vs. FOLH1-low among CRPC tumors with and without NE features. c, Venn diagrams illustrate the overlap of differentially expressed genes in FOLH1-high cohorts, with FOLH1 potential transcription factors estimated by Cistrome DB21.

