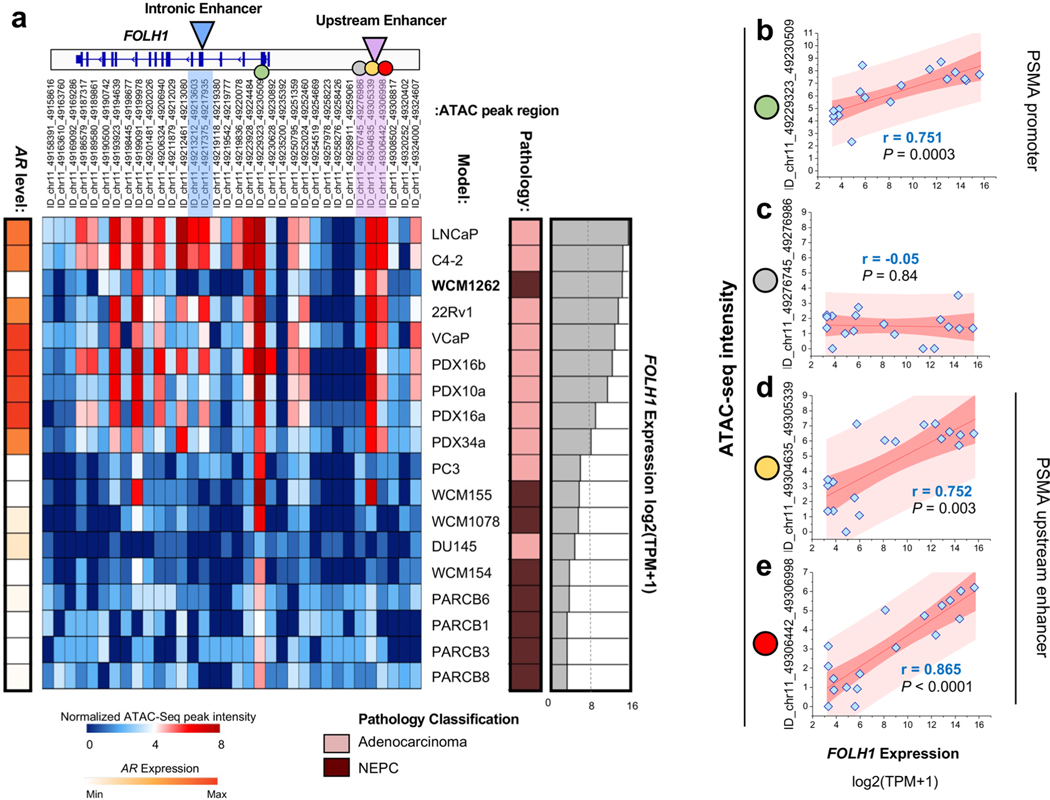
Extended Data Fig. 7 |. Gene expression of PSMA (FOLH1) in preclinical models and corresponding chromatin accessibility of its promoter and upstream enhancer are highly correlated.
a, Heat map of ATAC-seq intensity among prostate cancer models at the FOLH1 gene annotated with FOLH1 expression in each sample. Pearson correlation between the intensity of ATAC-seq peak and the expression of FOLH1 at promoter (b), close to upstream enhancer (c) and on upstream enhancer (d-e). Data from GEO accession GSE19919025. In b-e, the scatter plots show the intensity of ATAC-seq peak (y axis) and the expression of FOLH1 (x axis) for N = 18 preclinical prostate cancer models.

