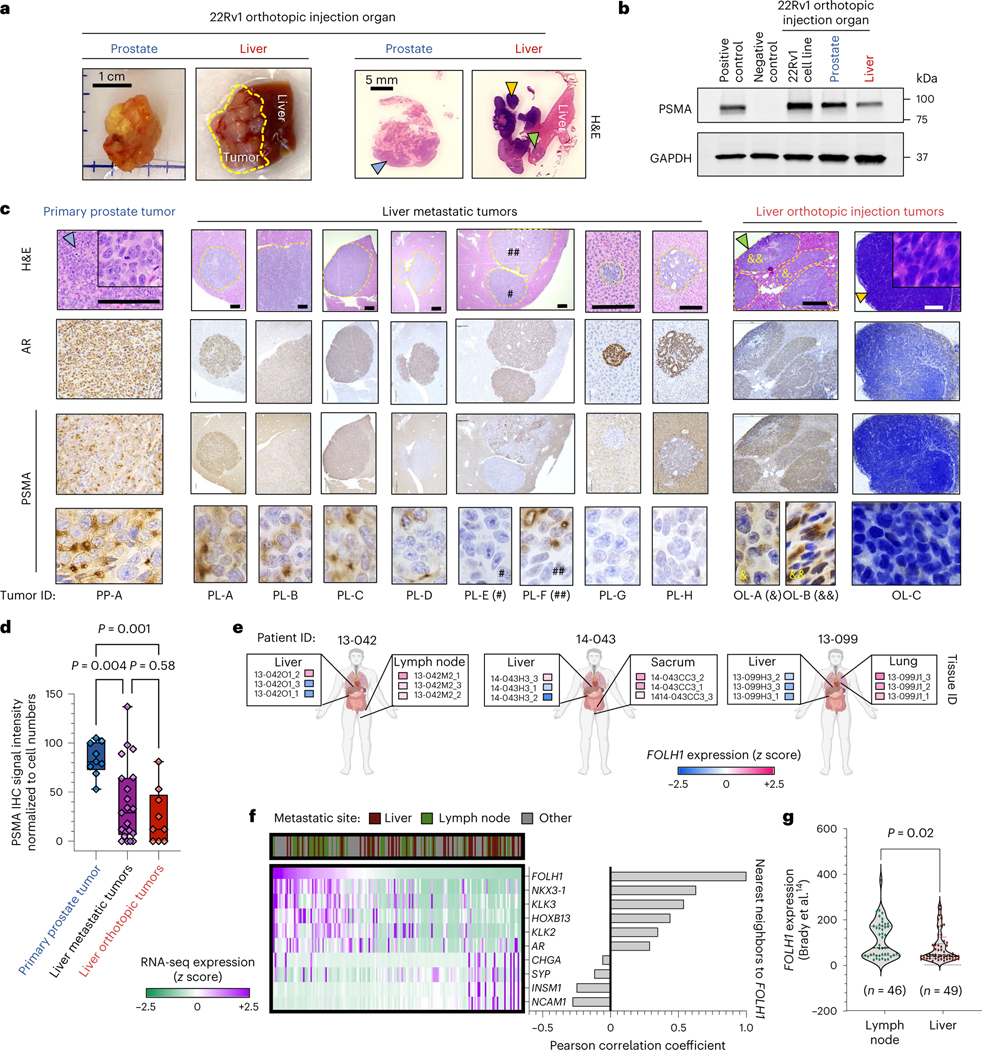
Fig. 2 |. Intra-tumoral heterogeneity of PSMA in liver lesions.

a, Representative image of the formed tumors following orthotopic injection of PSMA-positive 22Rv1 cell line to prostate and liver of mice (left) and H&E staining of tumor tissues (right). b, Western blot analyses of PSMA in 22Rv1 tumors following orthotopic injection to prostate in comparison with liver. c, PSMA and AR IHC and H&E staining in primary and liver metastases of prostate orthotopic 22Rv1 model in comparison to liver orthotopic 22Rv1 model. Scale bars, 200 μm d, PSMA IHC signal intensity in metastases of orthotopic 22Rv1 models, including primary prostate tumor (n = 9), liver metastatic tumors (n = 21) and liver orthotopic tumors (n = 9). The line inside each box is the median, upper box border represents the 75th quartile, lower box border represents the 25th quartile and whiskers represent the range. e, Expression levels of FOLH1 by DSP of three patients with CRPC from the UW Rapid Autopsy Program15. f, Heat map of DSP expression levels of PSMA gene (FOLH1), AR markers and NE markers in patients with CRPC from the UW dataset (n = 169 tumors). g, DSP expression levels of FOLH1 among samples from liver metastases versus lymph node metastases. The data were analyzed by either Student’s t-test (g) or one-way ANOVA followed by Tukey’s multiple comparison test (d). Representative blots are shown for n = 2 independently collected samples (b) or n = 3 mice (a,c).
