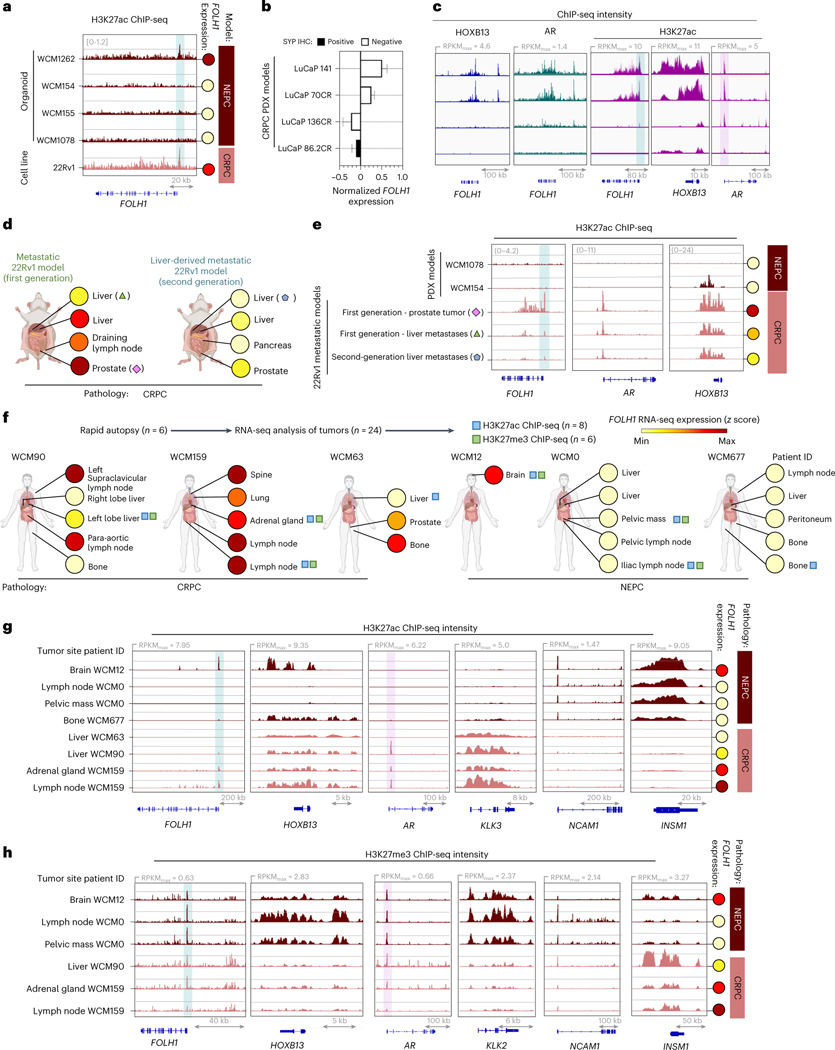
Fig. 5 |. PSMA suppression is associated with H3K27ac and H3K27me at FOLH1 gene locus.
a, Snapshots of H3K27ac ChIP-seq intensity at FOLH1 loci in association with FOLH1 expression levels in NEPC organoid models and 22Rv1 cell line. b, FOLH1 expression levels in LuCaP CRPC PDX models c, Snapshots for HOXB13 (blue), AR (green) and H3K27ac (purple) ChIP-seq in LuCaP CRPC PDX models with a heterogeneous FOLH1 expression level from GEO accession GSE130408 (ref. 33) (mean ± s.d.). d, Overview of FOLH1 expression levels in 22Rv1 models and the selected samples for H3K27ac ChIP sequencing. e, Snapshots of H3K27ac ChIP-seq intensity at FOLH1, AR and HOXB13 loci in association with FOLH1 expression levels in metastatic 22Rv1 models. f, Overview of rapid autopsies and H3K27ac and H3K27me ChIP sequencing of selected tumors from the WCM study cohort and schematic illustration of anatomic sites of samples and the expression levels of PSMA in each sample. h, Snapshots of H3K27ac ChIP-seq intensity and f, H3K27ac ChIP-seq intensity at FOLH1, HOXB13 and luminal and NE markers loci in association with FOLH1 expression levels. Genomic coordinates are indicated below.

