
Extended Data Fig. 1 |. PSMA (FOLH1) gene expression is mostly correlated with AR and NEPC markers except in liver metastatic tumors with no NE features.
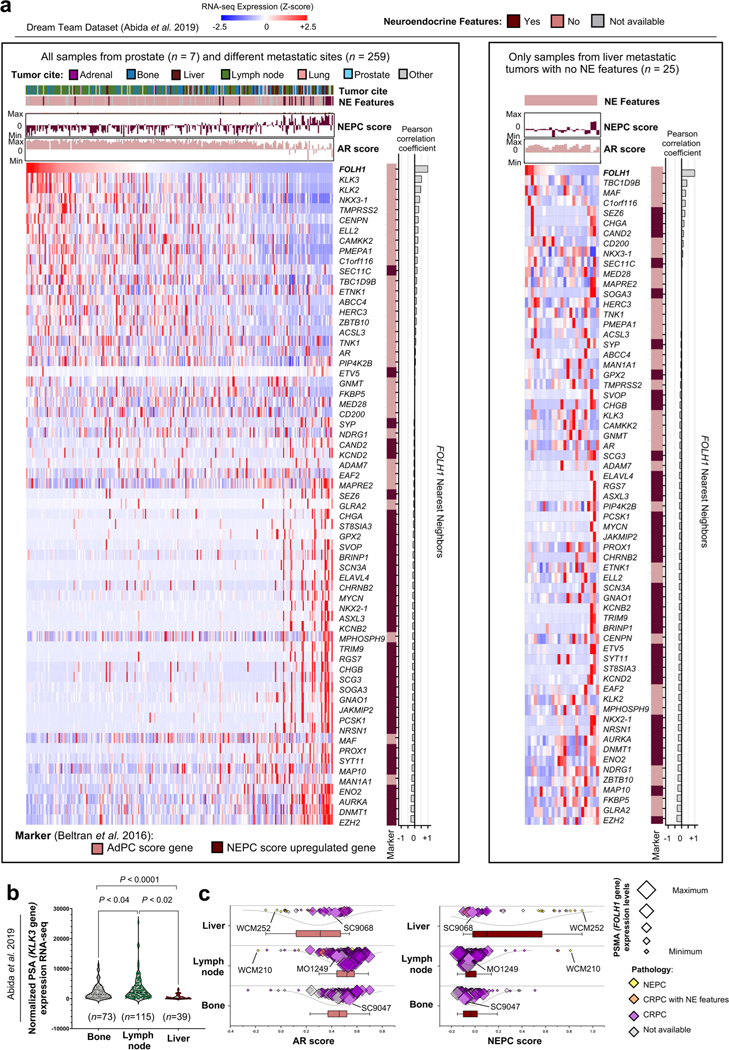
a, Heatmaps of the expression levels of PSMA gene (FOLH1), AR-markers and NE markers in metastatic CRPC samples from the International SU2C/PCF Dream Team dataset13. b, Expression of PSA gene (KLK3) and sites of metastases in the International SU2C/PCF Dream Team CRPC dataset13. c, AR score (left) and NEPC score (right) liver (n = 39), lymph node (n = 115) and bone (n = 73) metastatic CRPC samples in the International SU2C/PCF Dream Team dataset. The size of data points is proportional with the level of KLK3 gene expression in each sample. The lines and squares inside each box are the median and mean, respectively. The upper box border represents the 75th quartile, lower box border represents the 25th quartile and whiskers represent outliers by using the 1.5 interquartile range rule. In b, the data were analyzed by one-way ANOVA followed by Tukey’s multiple comparison tests.