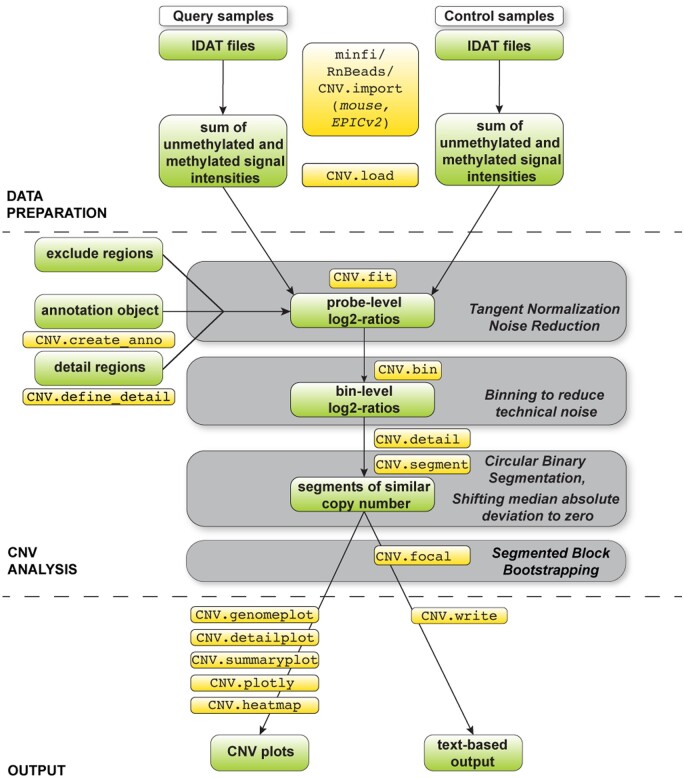
Figure 1.
Illustration of the conumee 2.0 workflow. Data objects and commands are indicated. Gray boxes illustrate key steps of the workflow. During data preparation, summed signal intensities for query and control samples are calculated separately. The CNV analysis itself comprises tangent normalization, a genomic binning step, circular binary segmentation, and segmented block bootstrapping.

