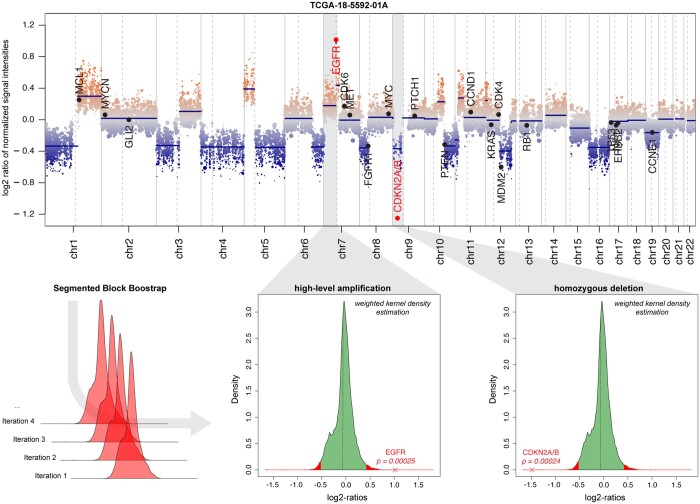
Figure 4.
Detection of high-level alterations. Genome plot shows CNVs across a single query sample from the TCGA LUSC cohort. Indicated regions harbor a high-level amplification of EGFR and a homozygous deletion of the CDKN2A/B locus. Density plots illustrate the segmented block bootstrapping approach which allows for the calculation of empirical P-values to assess the statistical significance of identified focal CNVs.

