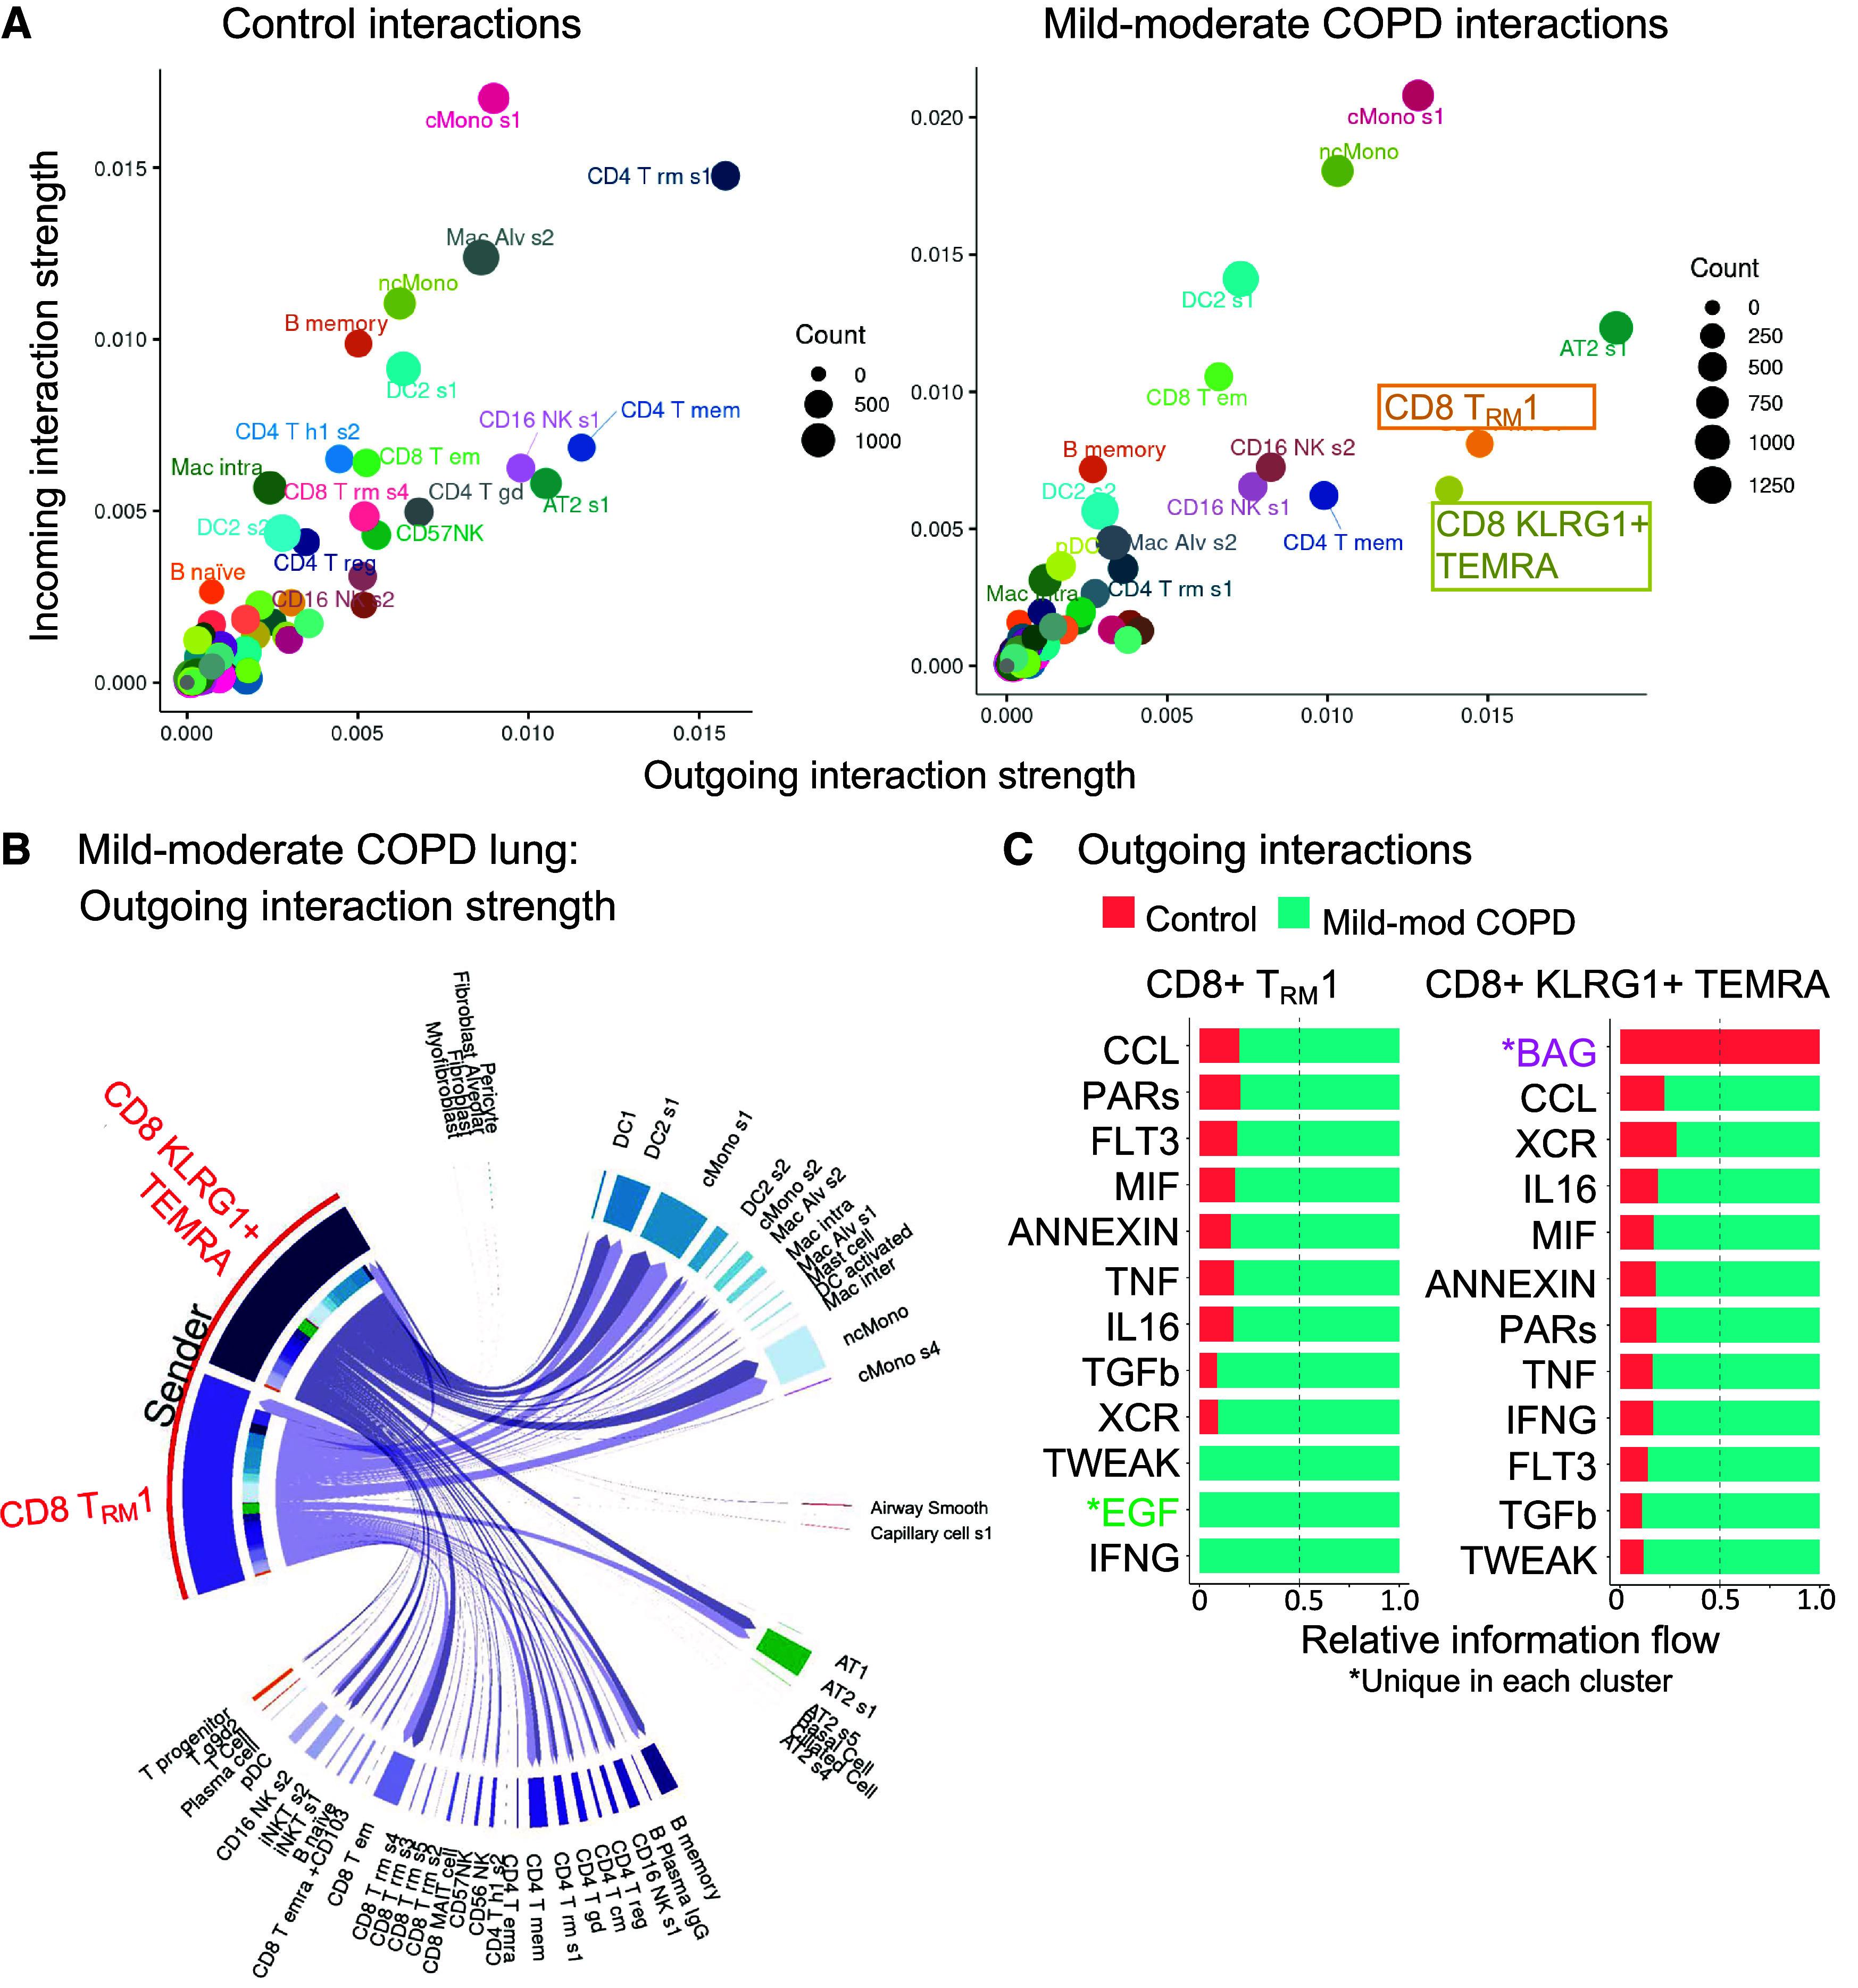
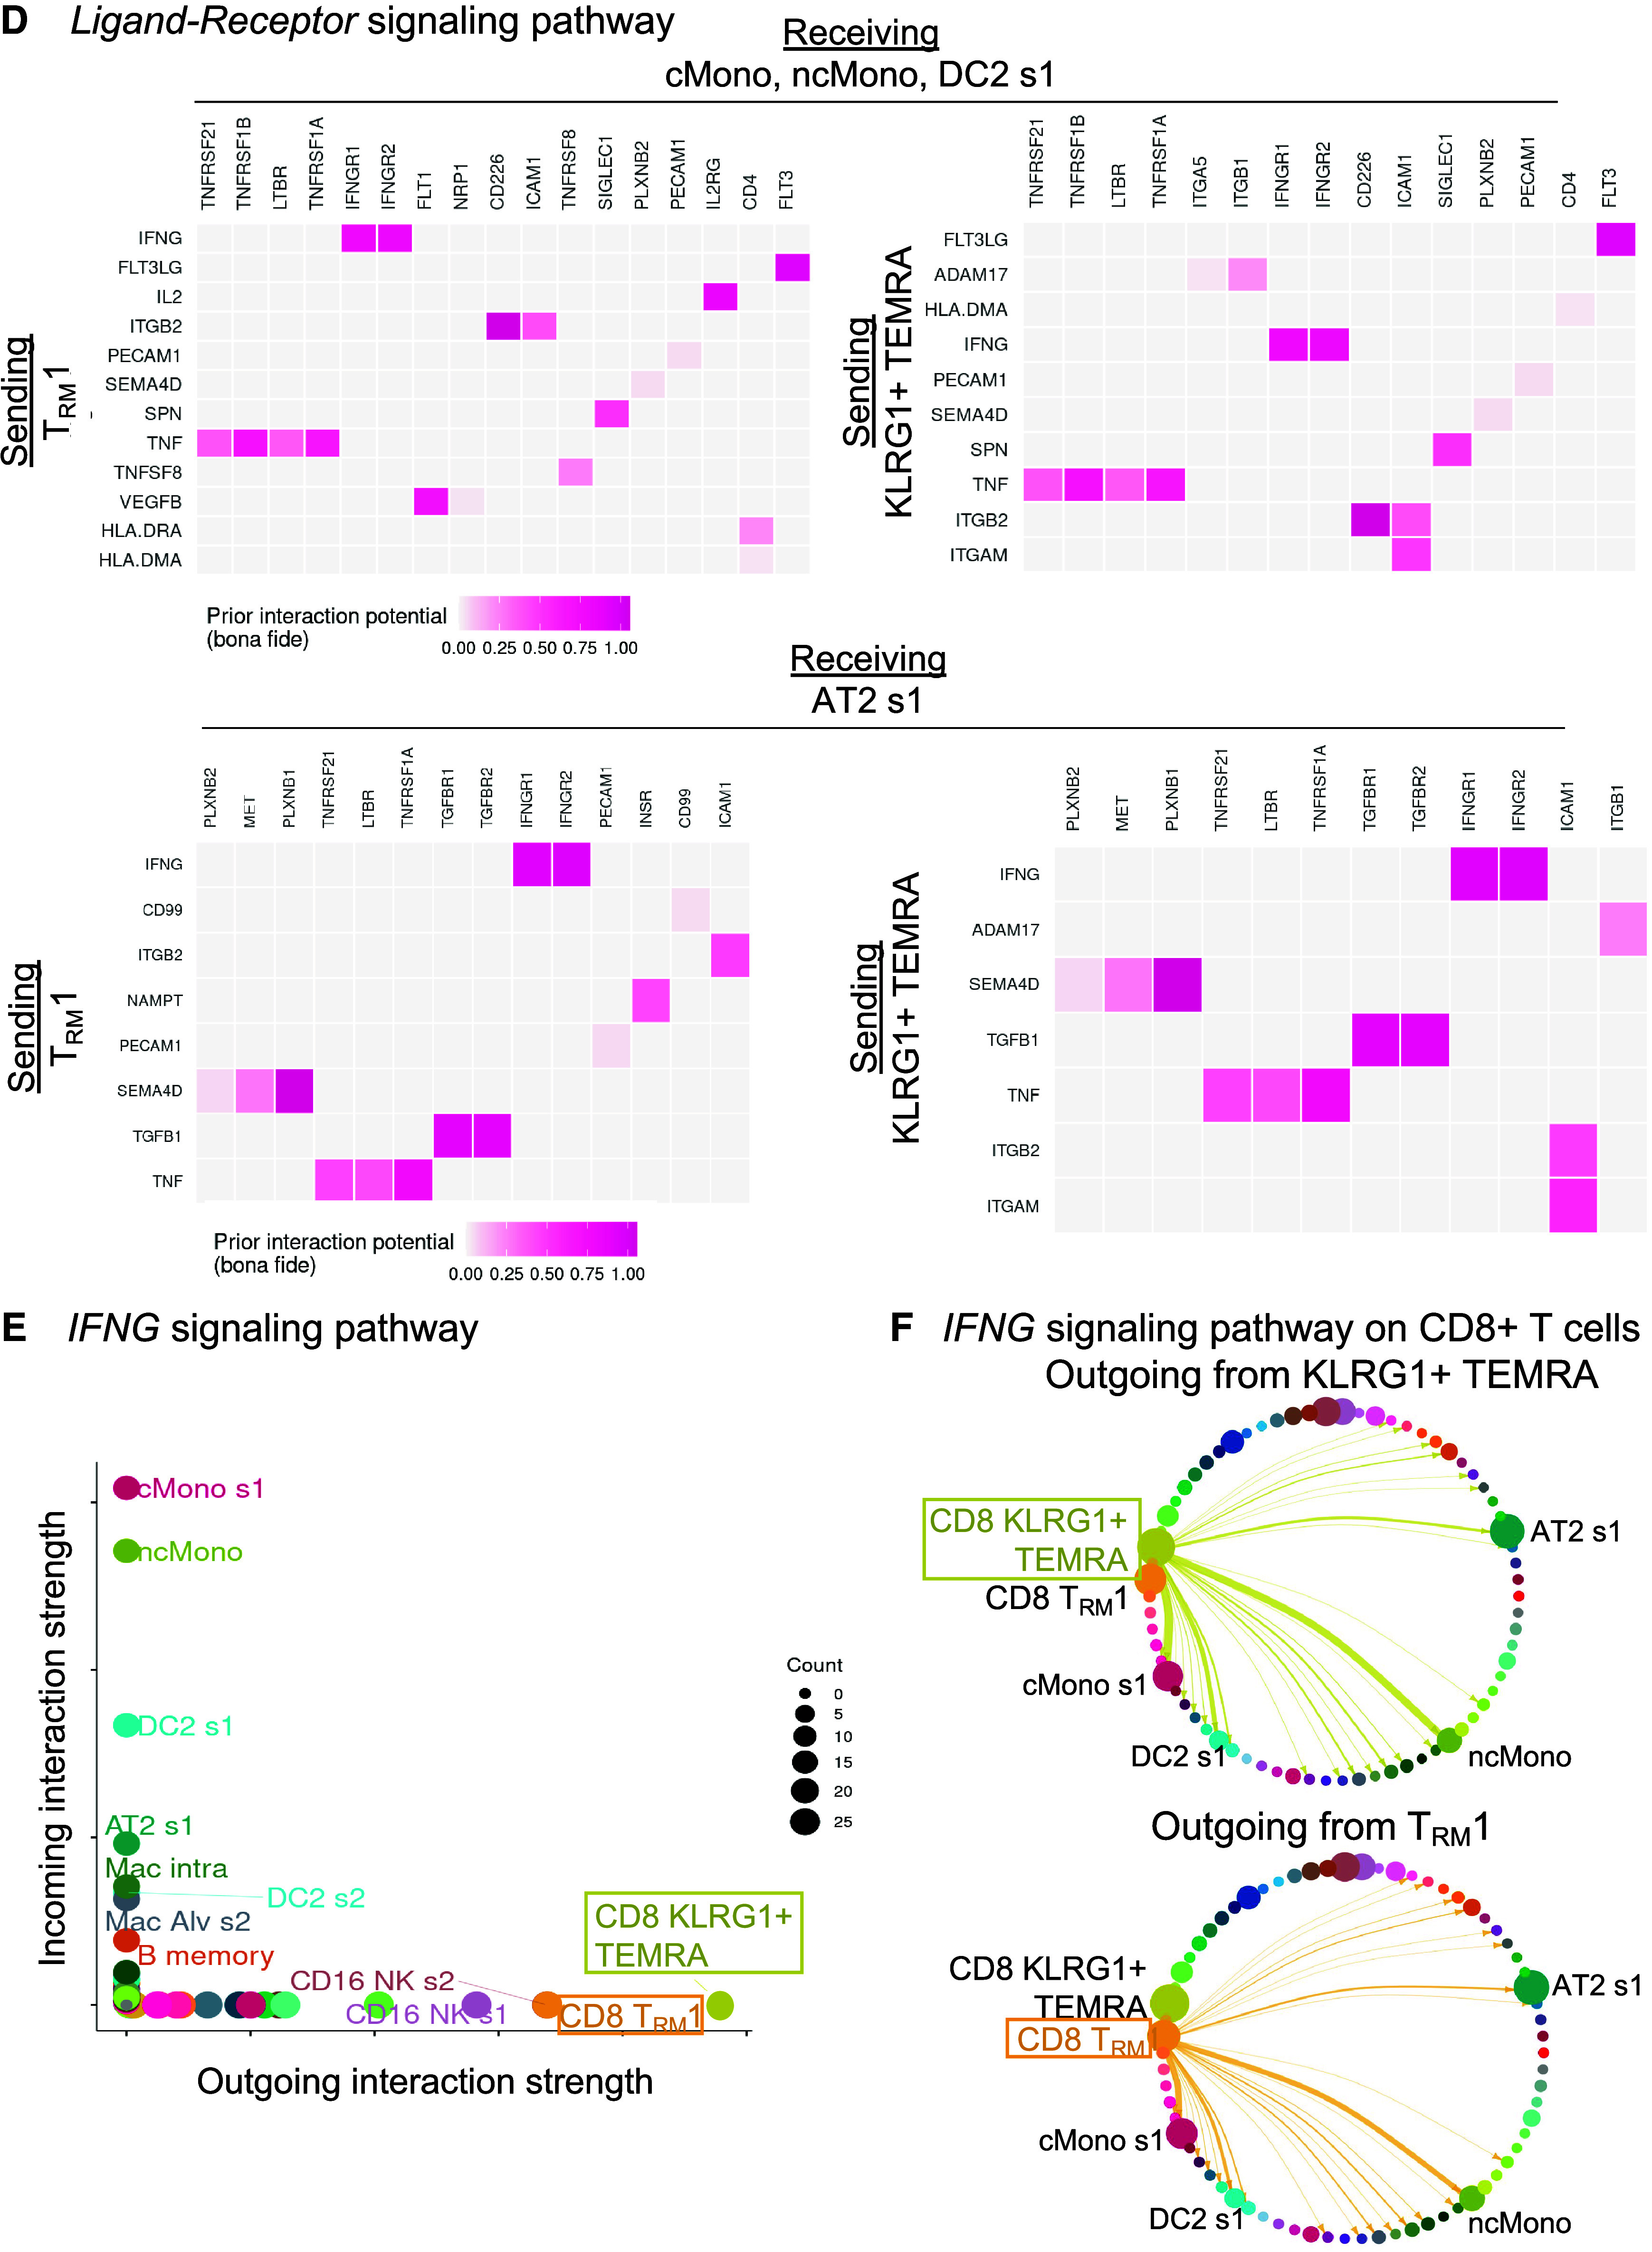
Figure 3.


CD8+ T cells interact with myeloid and alveolar type II (AT2) cells by inflammatory axes in mild-moderate chronic obstructive pulmonary disease (COPD) lung. Interactome analyses were performed on the single-cell RNA-sequencing (scRNA-seq) dataset of lung tissue from the control or mild-moderate COPD patient subcohorts. (A–C, E, and F) Statistically significant interactions determined by the CellChat pipeline are shown. (A) Total strength of incoming (y-axis) and outgoing (x-axis) interactions for each cell cluster, by patient subcohort. (B) For CD8+KLRG1+ T effector memory CD45RA+ (TEMRA) and T resident memory 1 (TRM1) cells (red), outgoing interactions in mild-moderate COPD lung. Color density is proportional to interaction strength. Receiving cell color indicates lineage (lymphoid, purple; epithelial, green; myeloid, blue). (C) For CD8+KLRG1+ TEMRA and TRM1 cells, the strongest outgoing interactions (and their relative strength in control versus mild-moderate COPD). *Unique in each cluster. (D) Interactions were tested by the Nichenet pipeline. Interactions increased in mild-moderate COPD lung compared with control lung with adjusted P value < 0.05 are shown. Sending cells are CD8+KLRG1+ TEMRA or TRM1 cells. (Top) Receiving cells are pooled myeloid cells: classical (c) Monos (monocyte/macrophages), nonclassical (nc)Monos, and dendritic cells (DC2 cluster 1). (Bottom) Receiving cells are AT2 cluster 1. (E) For the IFNG signaling pathway in mild-moderate COPD lung, strength of incoming (y-axis) and outgoing (x-axis) interactions for each cell cluster. (F) For the IFNG signaling pathway, visualization of outgoing interactions from CD8+KLRG1+ TEMRA or TRM1 cells. Thickness of arrows and the size of receiving clusters are proportional to interaction strength. NK = natural killer.
