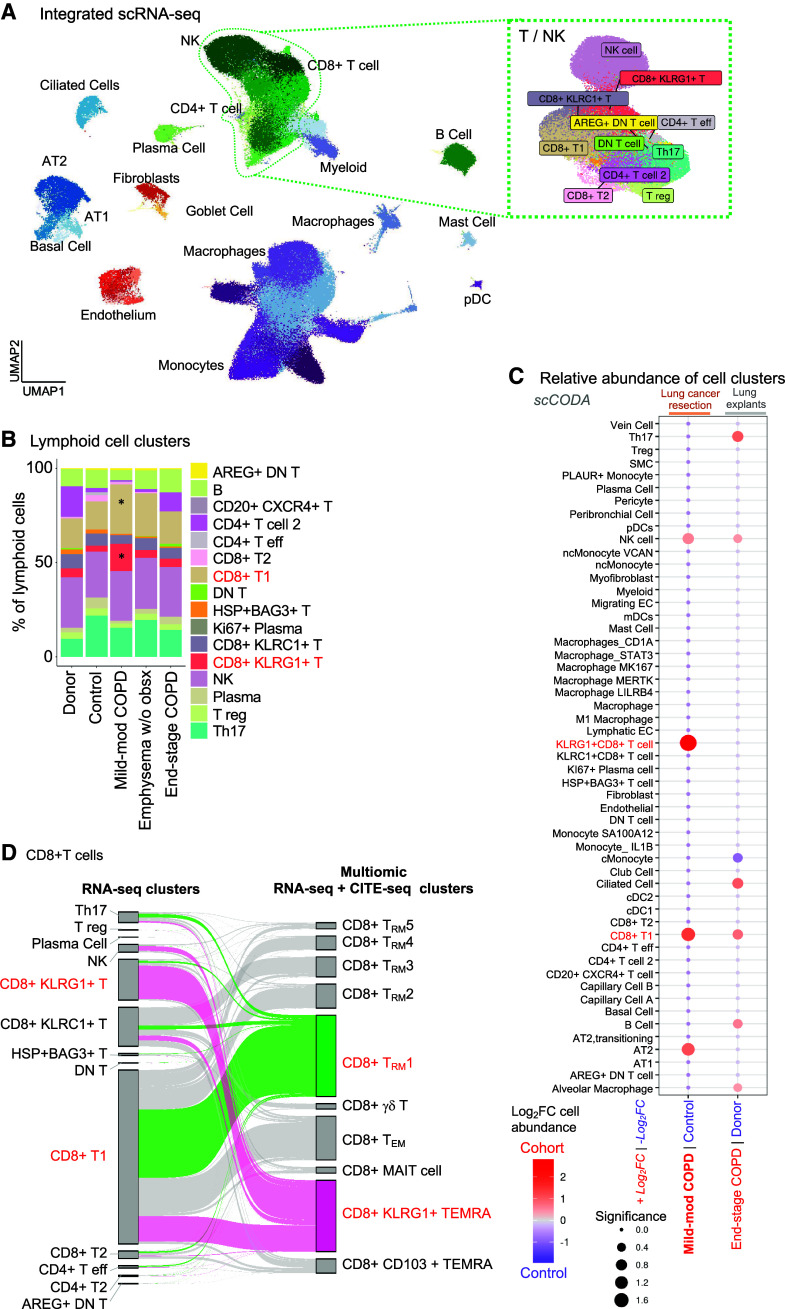
Figure 4.
CD8+KLRG1+ T cells have increased abundance in mild-moderate chronic obstructive pulmonary disease (COPD) lung compared with end-stage COPD. Single-cell RNA-sequencing (scRNA-seq) datasets from this study and Adams and colleagues (14) were integrated. (A) UMAP visualization of cell clusters with lineage indicated by color. Green dotted line denotes natural killer (NK) and T-cell clusters. (B) Relative abundance of lymphoid clusters, by patient subcohort. *Indicates CD8+ T1 (tan) and CD8+KLRG1+ (orange) T cells. (C) Relative abundance of cell clusters in pairwise comparison of patient subcohorts using the scCODA computational pipeline; red indicates cell clusters enriched in COPD compared with their respective control. Red text highlight CD8+KLRG1+ and T1-cell clusters. (D) On the left, CD8+ T cells in the scRNA-seq–only analysis (from Figure 4A) are mapped to themselves on the right in the multiomic (scRNA-seq/CITE-seq) analysis (from Figure 1B). The cell cluster annotations for either the RNA-seq only (left) or multiomic (right) analyses are shown. Cells in the KLRG1+ T effector memory CD45RA+ (TEMRA) and T resident memory 1 (TRM1) multiomic clusters are highlighted as pink or green, respectively.

