Figure 6.

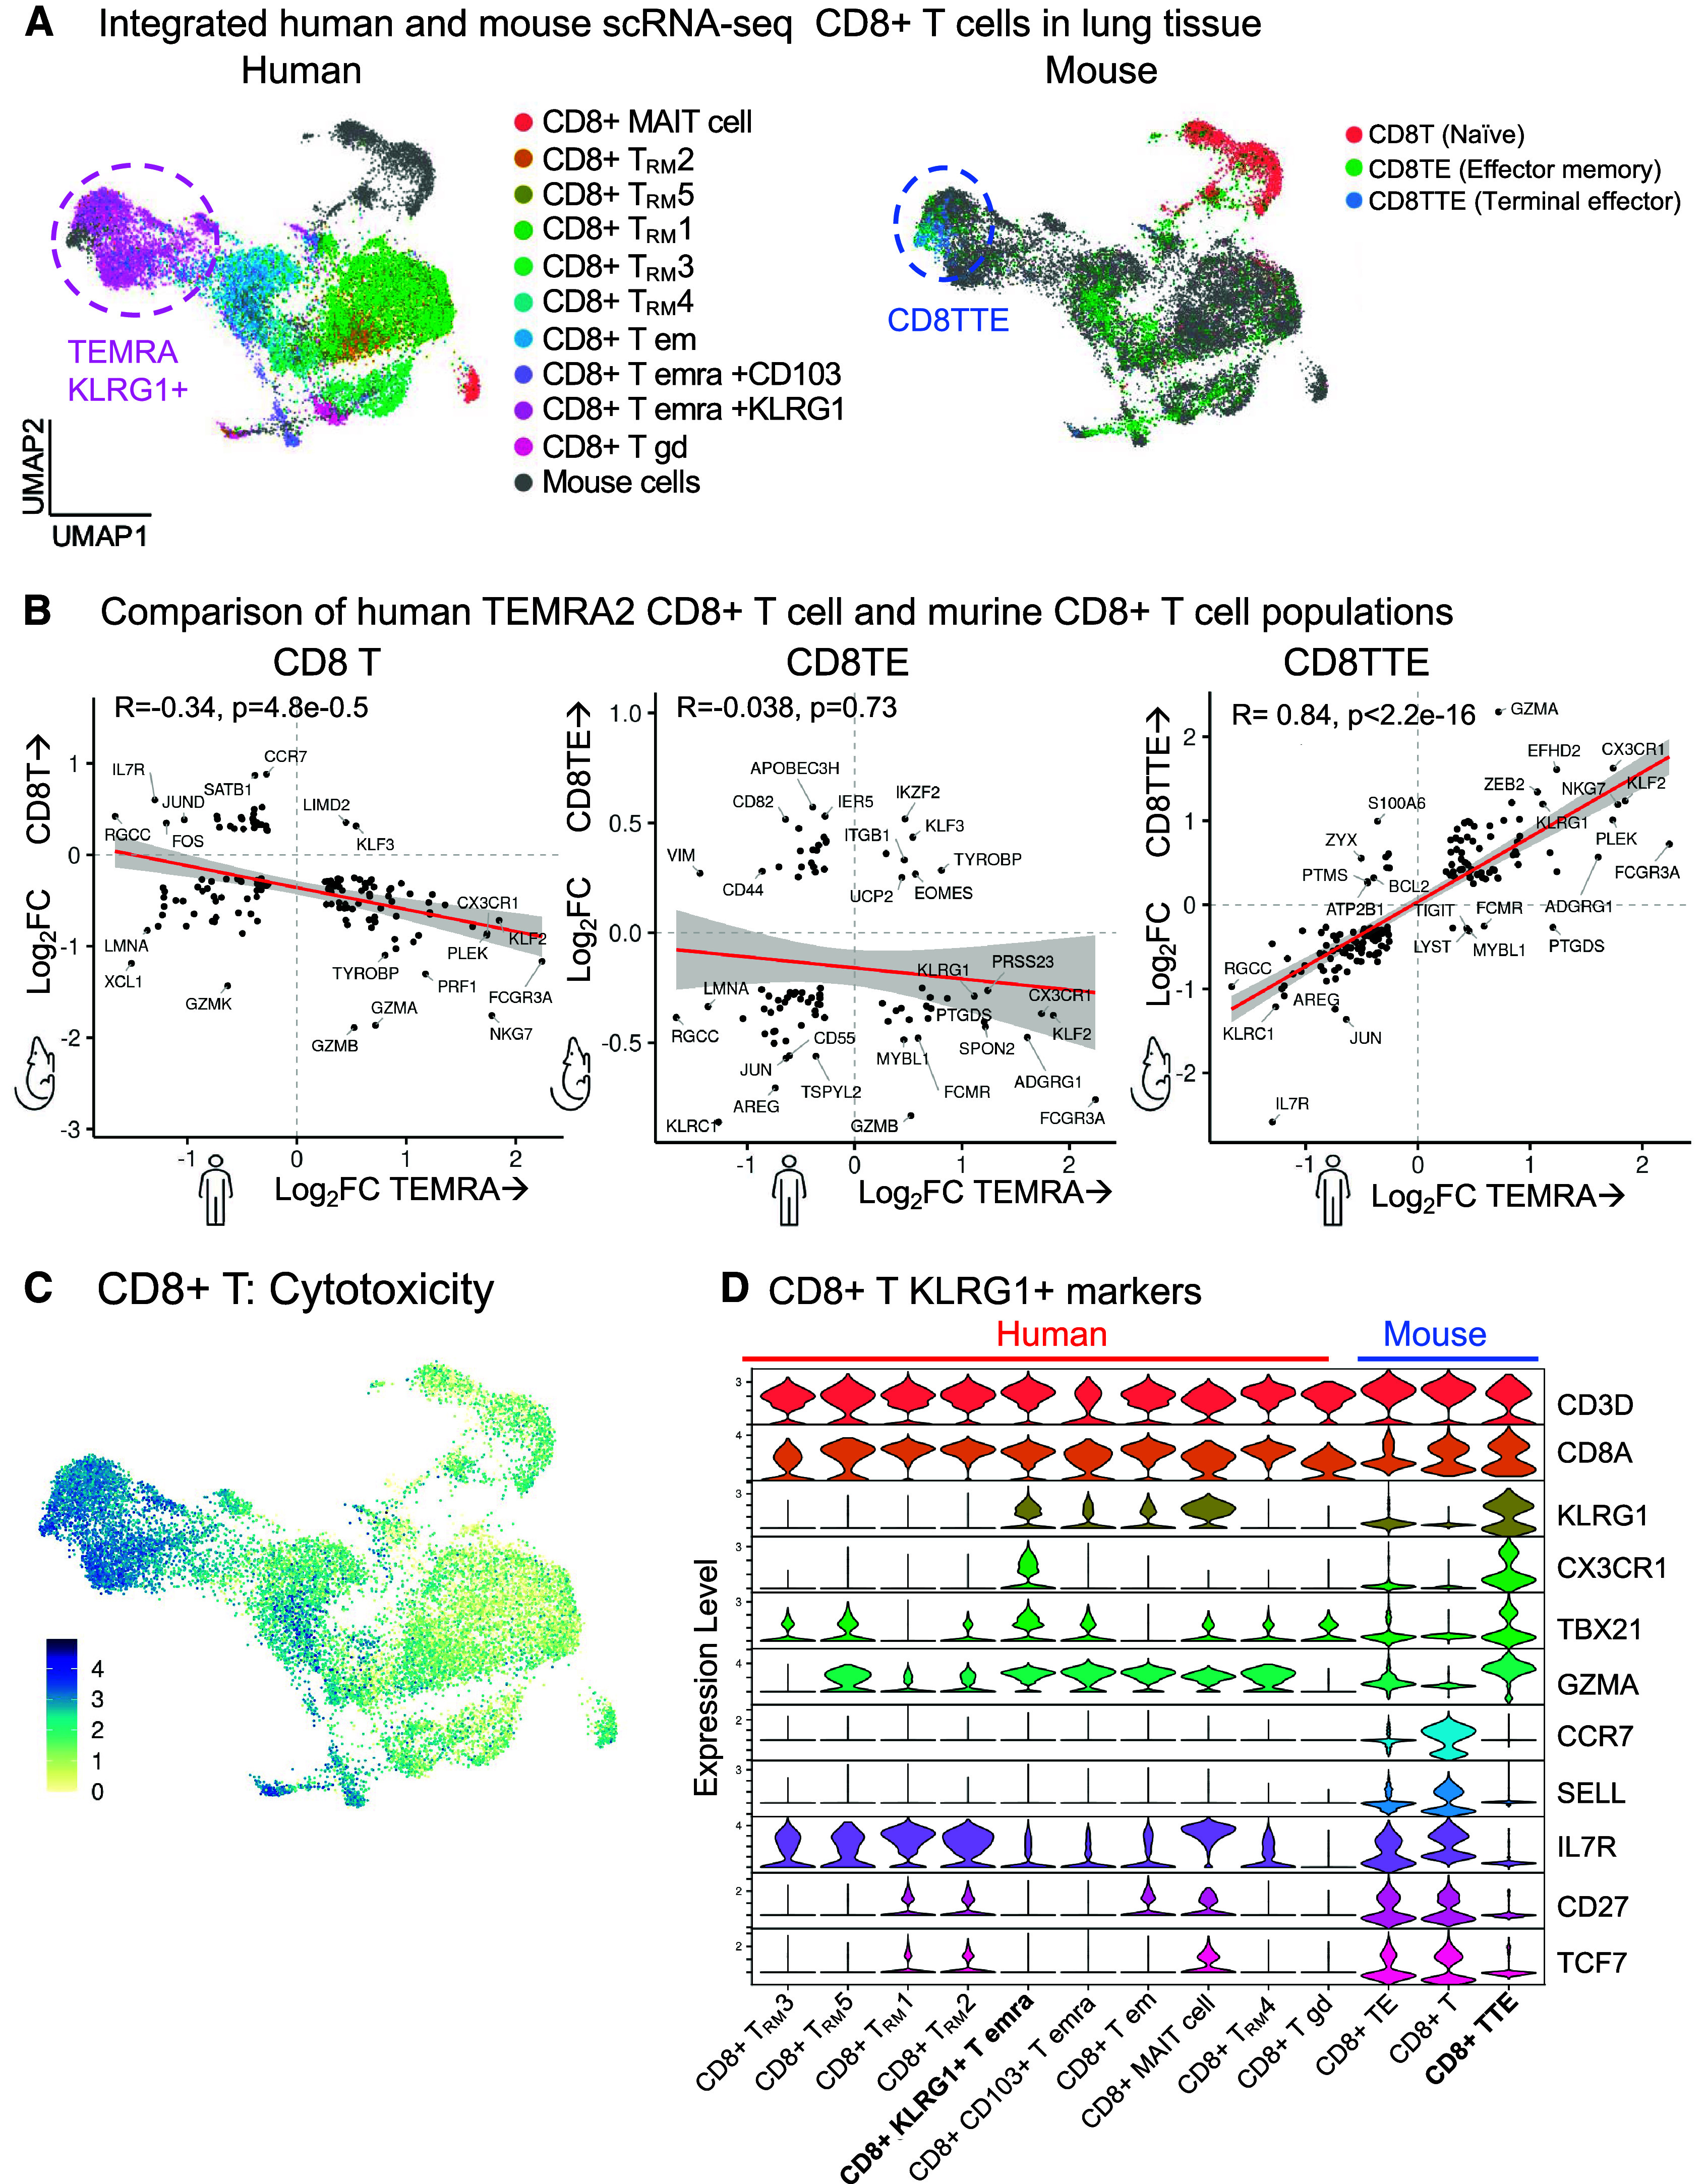
Comparative analysis of CD8+ T cells. Single-cell RNA-sequencing (scRNA-seq) datasets of human CD8+ T cells from this study and the Hhip+/− murine model of aging-associated chronic obstructive pulmonary disease (COPD) without smoke exposure (17) are compared. The human and murine datasets were integrated into one reference map. (A) Human (left) or murine (right) cells are mapped on UMAP visualizations of the integrated dataset. (B) Using pseudobulk analysis, the differentially expressed genes in murine CD8+ T cell subpopulations (y-axis) are compared with the differentially expressed genes in human CD8+KLRG1+ T effector memory CD45RA+ (TEMRA) cells (x-axis). For each CD8+ T-cell population, gene expression is compared with all the other CD8+ T cells in that human or murine dataset. Genes with log2fold-change (FC) > 0.25 and adjusted P < 0.01 are shown. (C) UMAP visualization of the cytotoxicity pathway. (D) Transcriptional expression of genes defining human and murine CD8+ T cell clusters. (B) Spearman correlation with linear model (red), 95% confidence interval (gray), Spearman coefficient (rs) and P value.
