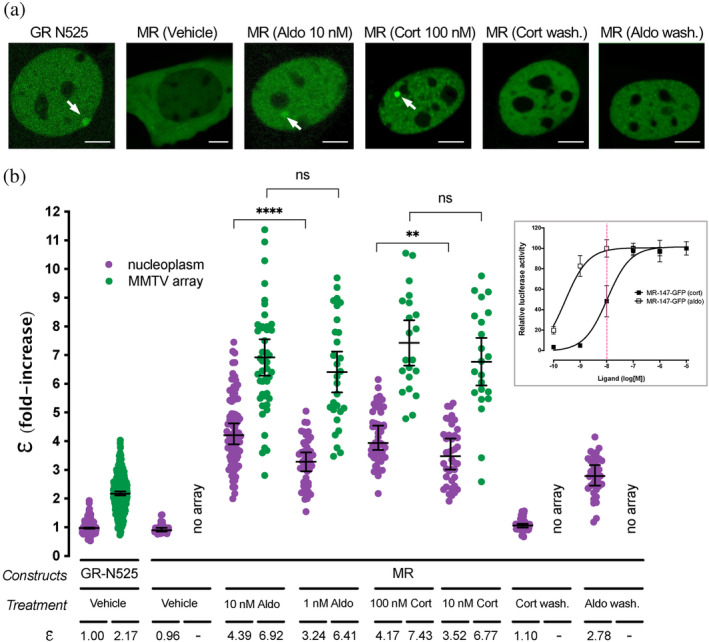
FIGURE 1.

Agonist‐bound MR adopts a tetramer conformation in the nucleoplasm and forms higher order oligomers at HREs. (a) Representative images of single cell nuclei expressing GFP‐GR‐N525 or MR‐GFP and treated with vehicle, 10 nM aldosterone (Aldo) or 100 nM corticosterone (Cort). In certain experiments, agonists were washed out after 1 h stimulation (wash.). White arrows point to the MMTV array. Scale bars: 5 μm. (b) Normalized molecular brightness (ε). Each point represents a single nucleus (n = 490, 307, 26, 82, 47, 45, 29, 50, 21, 40, 22, 55, 36 cells in each condition, from left to right). Individual points were pooled from the following number of independent experiments for each condition: 25, 2, 5, 3, 3, 3, 3, 2. Horizontal bars represent mean ±95% confidence interval (CI). Wash., washout. Statistical analysis for the selected pairs (MR 10 nM Aldo vs. 1 nM Aldo; MR 100 nM Cort vs. 10 nM Cort) was performed using an unpaired t test (****p < 0.0001; **p < 0.01; n.s., not significant). Inset, MR dose–response gene transactivation curves in response to aldosterone (aldo) and corticosterone (cort). Curves were obtained using wild‐type mouse MR transiently transfected in COS7 cells co‐expressing a luciferase gene reporter system and treated with the indicated concentrations of hormones for 16 h. Dashed red line highlights the difference in MR activity at 10 nM hormone concentration (data adapted from (Jimenez‐Canino et al., 2016)).
