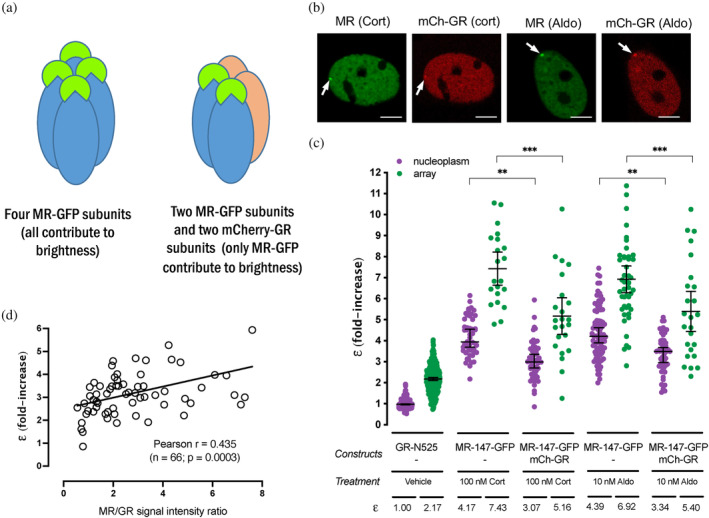
FIGURE 5.

GR displaces MR subunits from the oligomer. (a) Representative images of single cell nuclei expressing the indicated constructs. mCh, mCherry. White arrows point to the MMTV array. Scale bars: 5 μm. (b) Cartoon summarizing the rationale of the experiment. (c) MR molecular brightness (ε) assessed using the N&B technique. To facilitate comparison, data from Figure 1 showing ε for GR‐N525 and MR treated with 100 nM corticosterone or 10 nM aldosterone are included. Data points correspond to ε obtained from a single nucleus (n = 490, 307, 50, 21, 50, 23, 82, 47, 50 and 25 cells in each condition, from left to right). Individual points were pooled from the following number of independent experiments for each condition: 25, 3, 3, 5, 3. Statistical analysis was performed using one‐way ANOVA followed by Tukey test (results are shown only for two selected pairs; *p < 0.05; **p < 0.01; p < 0.001). (d) Linear correlation between eGFP‐MR ε values and the ratio of MR/GR fluorescence intensity. Each dot represents an individual nucleus. Pearson lineal correlation coefficient was computed using Prism 9 (GraphPad).
