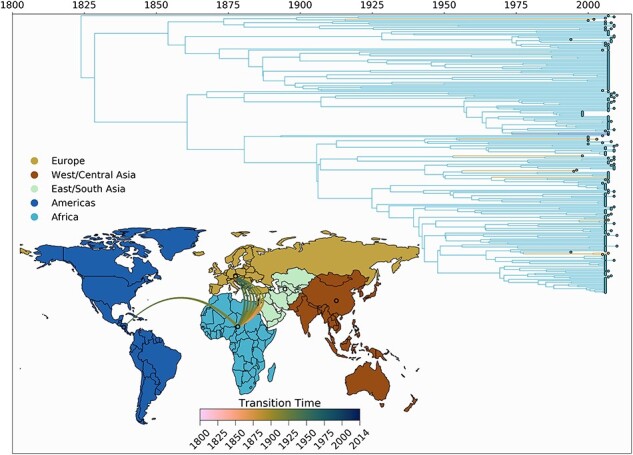
Figure 4.

Spatio-temporal transmission dynamics of HBV-A. Time-scaled maximum clade credibility tree representing the spatio-temporal history of HBV genotype A. The time of origin is inferred to be at 2504 bce. Tips and branches are colored according to inferred location. Breaks in the time axis represent long periods of time covered by individual branches. (inset) World map colored according to the geographic regions used for the discrete phylogeographic analysis. Each line represents an inferred transmission event between two regions (55 in total). Line colors denote timing intervals of each introduction. Concave up lines represent west to east movement, concave down lines represent east to west movement, concave right lines represent north to south movement, and concave left lines represent south to north movement. Europe shows the greatest number of outgoing introductions. West/Central Asia is the inferred root location of the tree, with one ancient transmission to Europe inferred to have taken place between 2243 and 876 bce.
