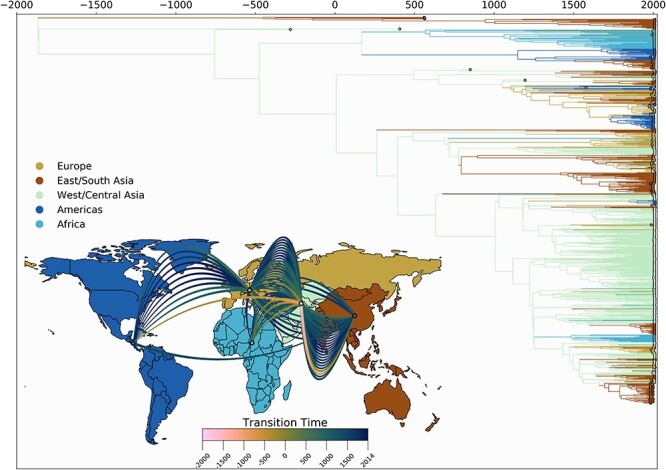
Figure 5.

Spatio-temporal transmission dynamics of HBV-D. Time-scaled maximum clade credibility tree representing the evolutionary history of HBV genotype D. The time of origin is inferred to be at 1779 bce. Tips and branches are colored according to inferred locations. (inset) World map colored according to the geographic regions used for the discrete phylogeographic analysis. Each curved line represents an inferred transmission event between two regions (ninety-two in total). Line colors denote timing intervals of each introduction. Concave up lines represent west to east movement, concave down lines represent east to west movement, concave right lines represent north to south movement, and concave left lines represent south to north movement. West/Central Asia shows the greatest number of outgoing transmission events, as well as being the most likely location of the most recent common ancestor to sampled modern sequences.
