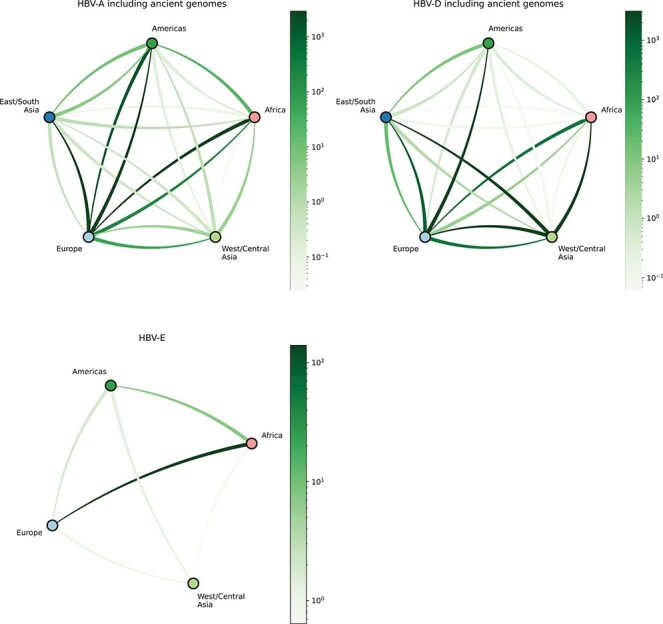
Figure 7.

Bayes factor support for HBV’s geographic transitions. Networks representing posterior support for migrations between geographic regions as determined by BSSVS analysis. Inferred migrations are represented as curved lines. Bayes factors are represented by color intensity; darker lines depict higher Bayes factors, therefore higher posterior support. Direction of movement is represented by anticlockwise curvature of each line. In HBV-A, we estimate strongly supported migrations out of Europe to all other regions, as well as high support for inferred migrations into Europe from Africa and the Americas. In HBV-D, we observe well-supported migration history from Africa to Europe, and from Europe to the Americas and Asia. Finally, in HBV-E, we observe very strong support for migration from Africa to Europe, as well as relatively high support for migration from Africa to the Americas.
