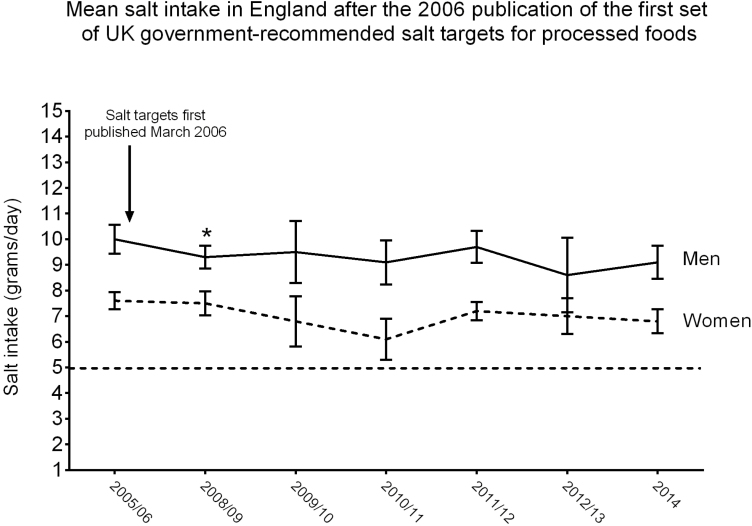
Figure 1.
Arithmetic means and 95% confidence intervals for salt intake in men and women in England2 before and after the 2006 publication of the first set of UK-government recommended salt targets for processed foods. The straight dashed line represents the level of salt intake recommended by the World Health Organization. *Statistically significant decrease in salt intake only in men, and only between 2005/06 and 2008/09 as reported by Public Health England.2 In women, there was no statistically significant downward step-change between 2006/06 and 2008/09 or between later years. The trend analysis reported by Public Health England was performed with log-transformed data and geometric means due to the skewed nature of the raw data.2

