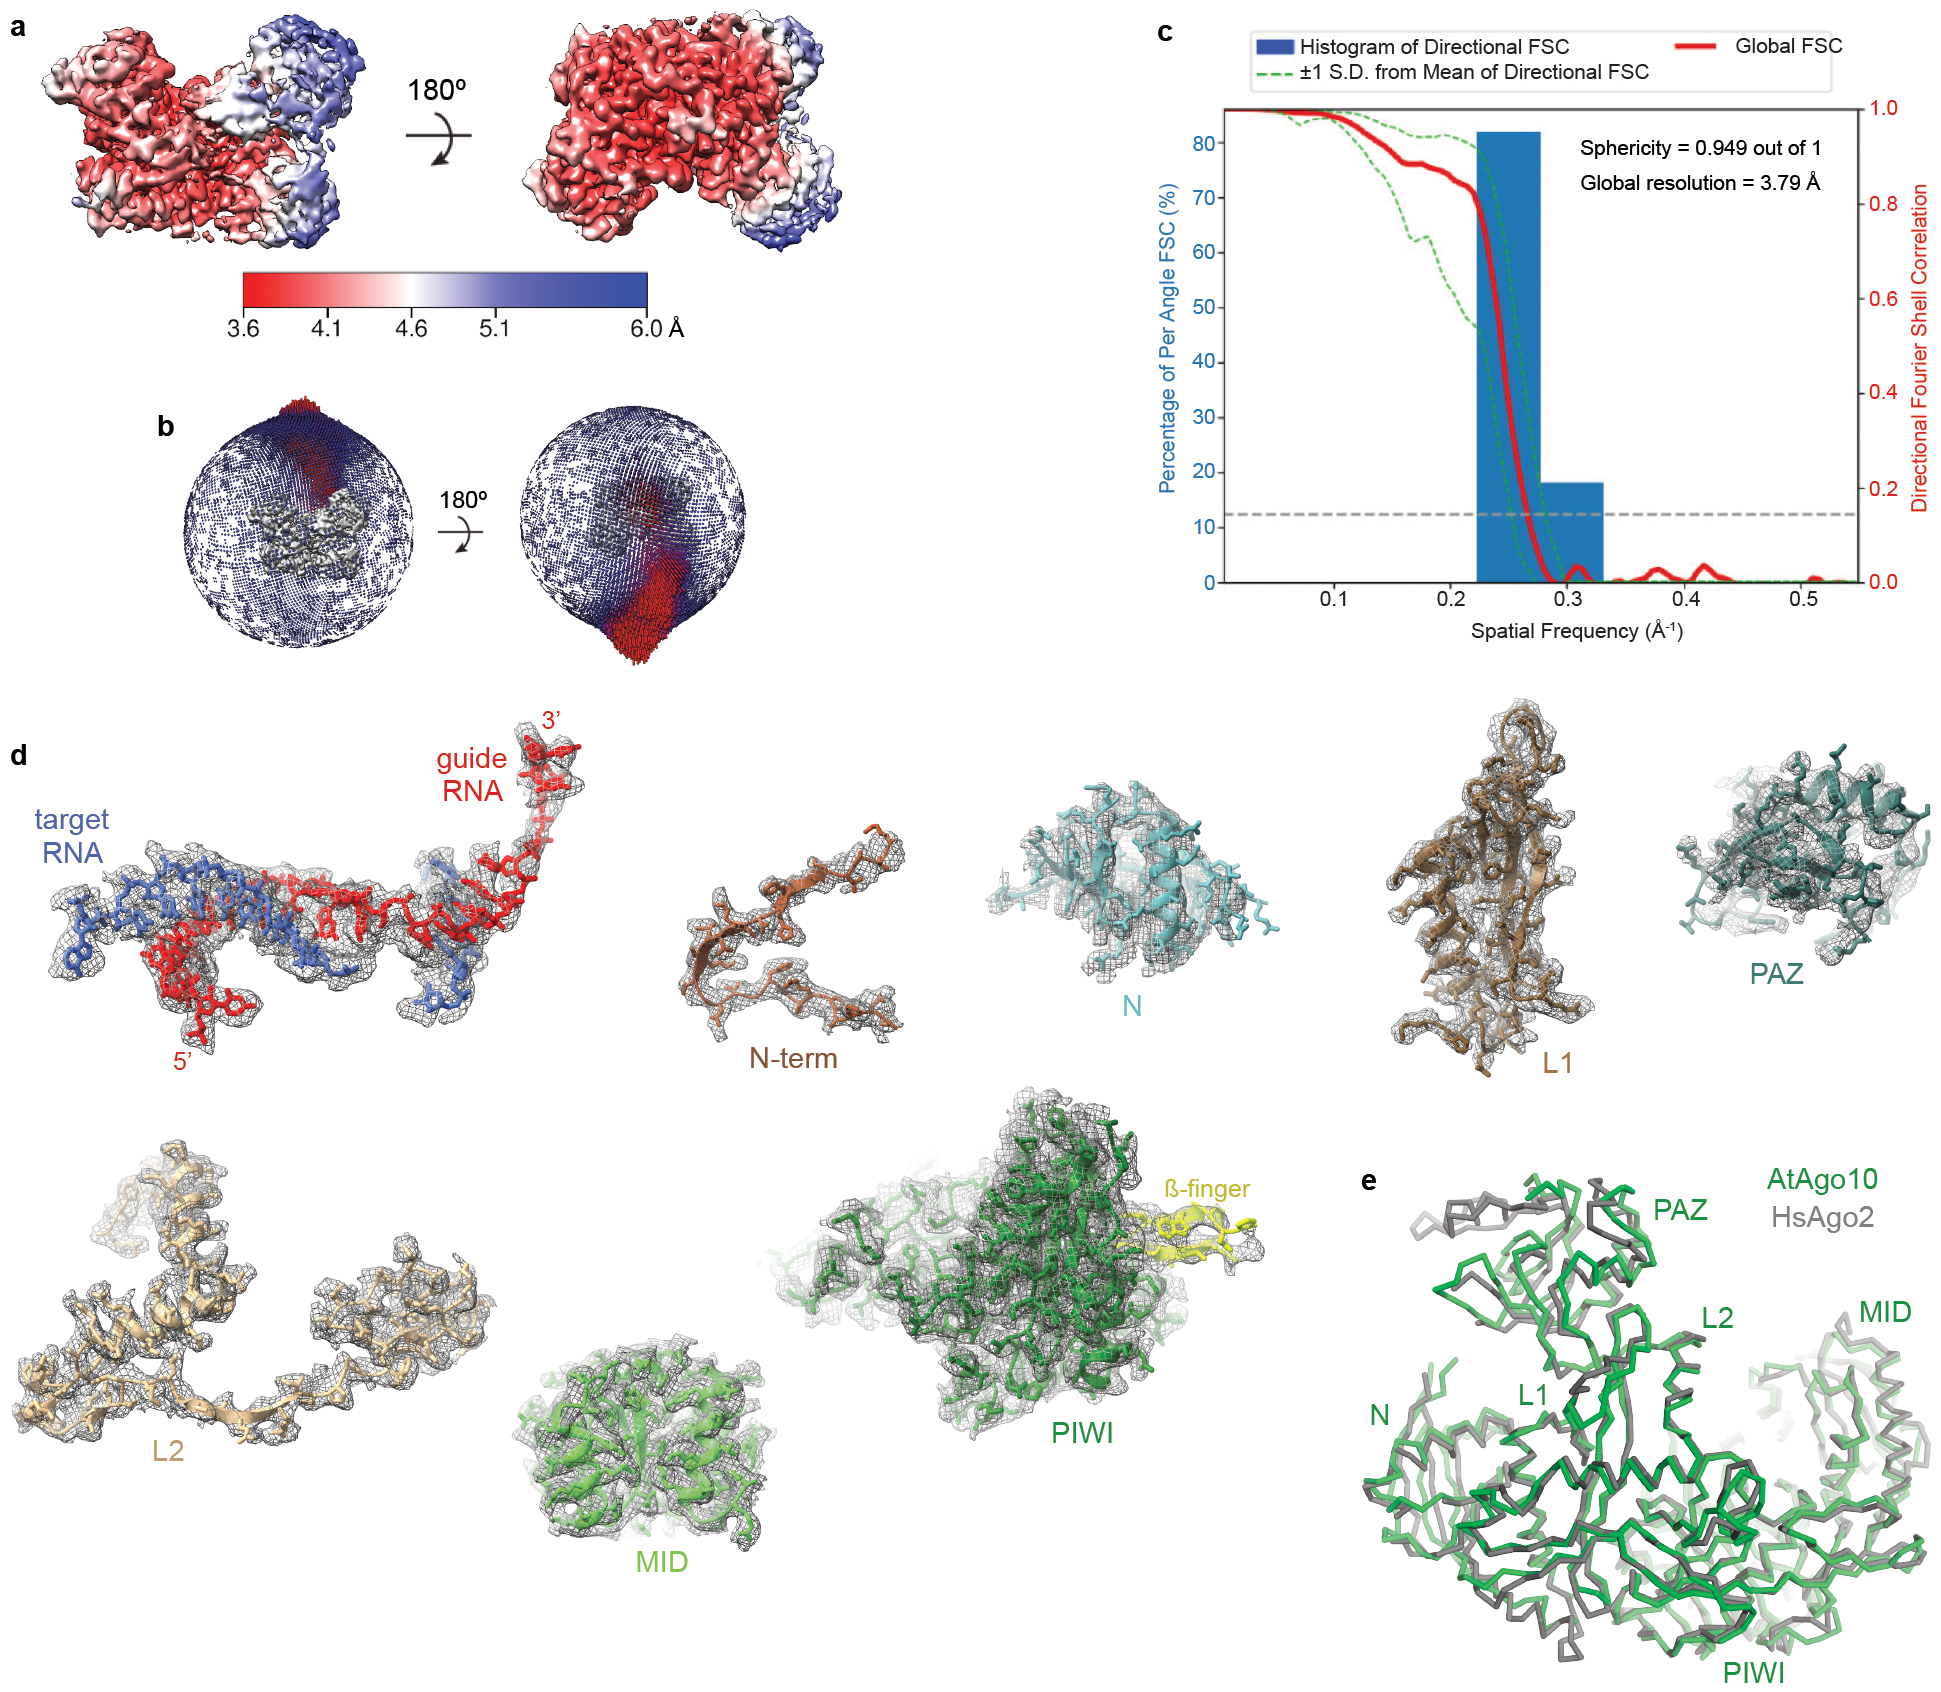
Fig. EV5. Reconstruction of the AtAgo10-guide-target bent-duplex conformation.

a. Final 3D map for Conformation-2 (see Fig. EV4) of the AtAgo10-guide-target RNA complex colored by local resolution values. b. Angular distribution plot showing the Euler angle distribution of the AtAgo10-guide-target particles in the final reconstruction. The position of each cylinder corresponds to the 3D angular assignments and their height and color (blue to red) corresponds to the number of particles in that angular orientation. c. Directional Fourier Shell Correlation (FSC) plot representing 3D resolution anisotropy in the reconstructed map, with the red line showing the global FSC, green dashed lines correspond to ±1 standard deviation from mean of directional resolutions, and the blue histograms correspond to percentage of directional resolution over the 3D FSC. d. Guide-target duplex (shown as sticks) and individual AtAgo10 domains (shown in cartoon representation with side chains shown as sticks) fit into the EM density (shown in mesh). e. The bent-duplex conformation of AtAgo10 strongly resembles a previous bent duplex structure of HsAgo2 (PDB 6MDZ), with an RMSD of 1.5 Å for 634 equivalent Cα atoms.
