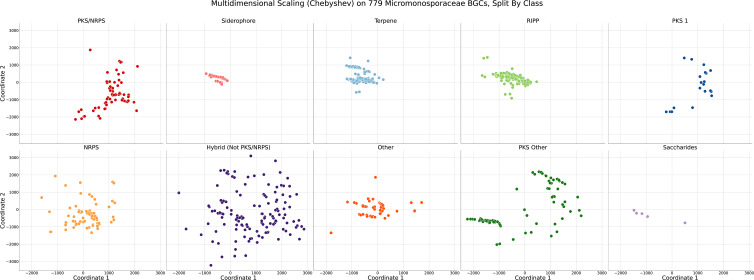
Fig. 4.
Scatter plots of Micromonosporaceae BGCs analysed via multidimensional scaling using Chebyshev pairwise distance. Each dot represents an individual BGC. Distance between BGCs is associated with GCFs in BiG-SLiCE to which they were most similar. Visualization was separated according to predicted BGC product type. The colour code represents the predicted BGC product type.

