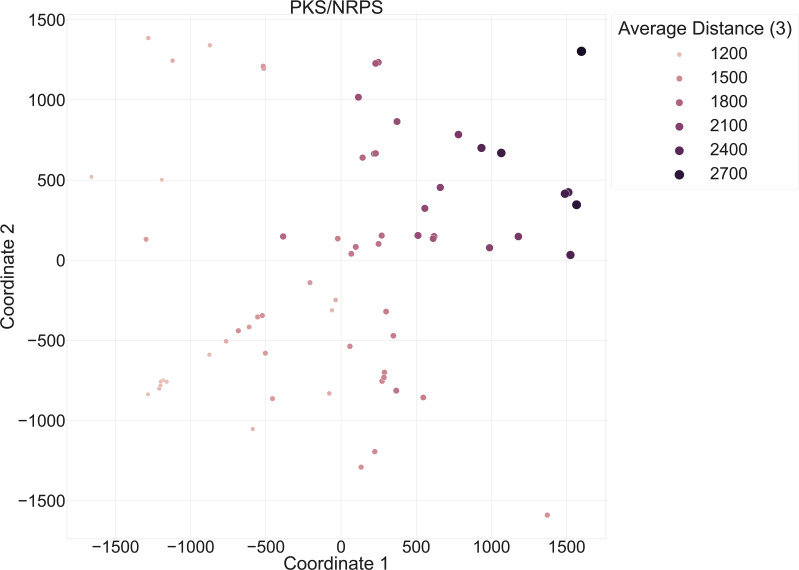
Fig. 7.
Annotated version of the improved scatter plot of PKS/NRPS Micromonosporaceae BGCs from Fig. 6. The hue and size of the dots were scaled based on the average distance of the BGCs, across the predicted BGC product type PKS/NRPS, to the top-3 GCFs in BiG-SLiCE (T=900).

