
Fig. 4.
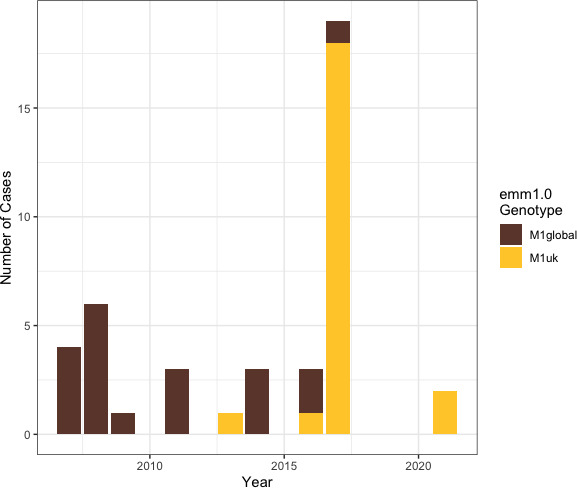
Characterization of our emm1 isolates as M1global or M1UK. Stacked bar graph of current study group A S. pyogenes infection isolates (n=42) grouped by year of isolation with columns coloured by emm1 genotype. Note that comparisons from 2007 to 2017 only include iGAS isolates collected within the HNELHD, and comparisons from 2019 to 2021 only include non-invasive isolates collected within the ISLHD. GAS isolates were not collected as part of this study during 2018.