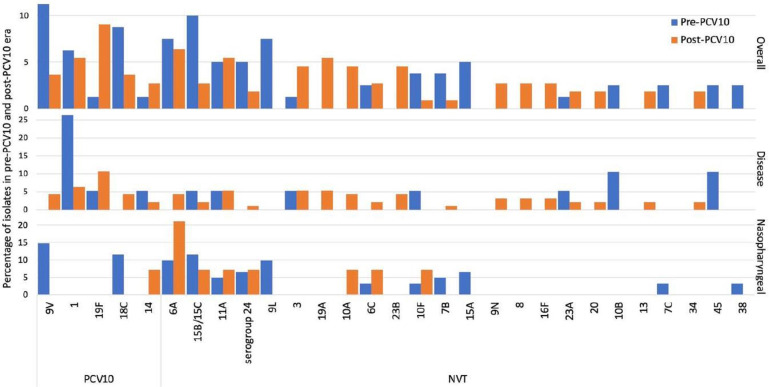
Fig. 1.
Distribution of pneumococcal serotypes before and after the introduction of PCV10 in Pakistan. Serotypes with at least two isolates in the complete dataset are shown. This figure shows the percentage of isolates of each serotype in the pre-PCV10 (blue) and post-PCV10 era (orange) in the complete dataset, and disease and nasopharyngeal isolates, respectively.

