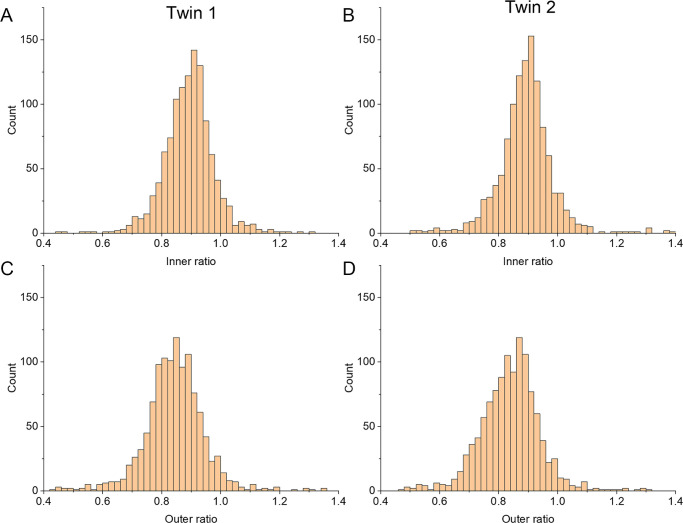
Figure 2.
Histograms showing distributions of inner and outer ratios. Inner ratio distributions for Twin 1 (A) and Twin 2 (B). Outer ratio distributions for Twin 1 (C) and Twin 2 (D). The designations of Twin 1 and Twin 2 are essentially random (relating to which participant was recruited first), and the finding of similar distributions for both groups (and the apparent shifting of the distribution of outer ratios to lower values in both cases) suggests these findings are internally reproducible.

