. 2024 Jan 17;16(7):3293–3323. doi: 10.1039/d3nr05332f

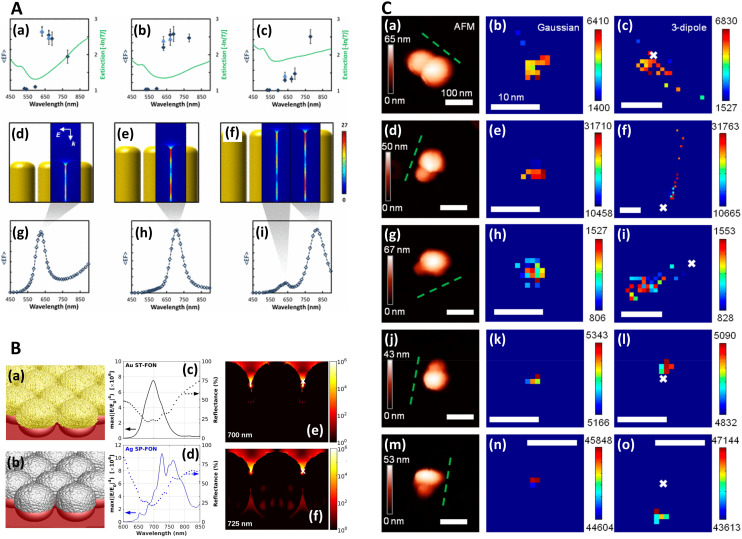
Fig. 1. Near-field, far-field studies in SERS. A. Experimental and modeled SERS enhancement factor, demonstrating the effect of a nanopillar cavity mode on SERS. (a)–(c) Graphs comparing the measured (raster-averaged) enhancement factor 〈EF〉 and optical extinction [−ln(T)] at normal incidence for nanorods with an average diameter of 48 nm; array period of 64 nm; and average lengths of (a) 85, (b) 125, and (c) 160 nm. The green lines indicate the optical extinction. Black-diamond and blue-triangle data points indicate the 〈EF〉 of the 915 cm−1 band of CV and the 775 cm−1 band of R6G, respectively. (d)–(f) Schematics of the modeled nanorod structures with 3 nm separation; array period of 64 nm; and lengths of (d) 85, (e) 125, and (f) 160 nm, overlaid with plots of local field on excitation of the third harmonic of the cavity. The fifth harmonic is also shown in (f) for the longest nanorods. (g)–(i) Graphs displaying the EF predicted by the finite-element method modeling for the nanorods shown in (d)–(f). The hollow diamond data points indicate the predicted enhancement factor for an imaginary 850 cm−1 Raman band. All enhancement factors are plotted at the excitation wavelength. Reprinted with permission from Doherty (2013) © American Physical Society.90 B. Finite-difference time-domain (FDTD) calculations for ‘spun’ and ‘stationary’ films over nanospheres nanostructured SERS substrates (SP-FONs and ST-FONs). Modeled geometries used in the FDTD simulations for the (a) Au SP-FON and (b) Ag ST-FON, respectively. Reflectance spectra (dotted lines) and fourth power of the near field (|E/E0|4, solid line) calculated within the gap (white mark in panels (e) and (f)) for the (c) Au SP-FON and (d) Ag ST-FON, respectively. Spatial distribution of |E/E0|4 around the (e) Au SP-FON (λ = 700 nm) and (f) Ag ST-FON (λ = 725 nm), respectively. Reprinted with permission from Kurouski (2017) © American Chemical Society.89 C. Superlocalization Surface-Enhanced Raman Scattering Microscopy. Atomic force microscopy (AFM) images and spatial intensity maps that indicate the average intensity of all centroids located within 1 nm bins. (Left column) AFM image with a three-dipole γ axis-fit (xy plane) estimate indicated by the dashed line, (center column) spatial intensity map using a 2D Gaussian model, and (right column) spatial intensity map using a three-dipole model. A white X indicates the average position of the 2D Gaussian centroid. Panels (a)–(i) show single molecule SERS examples, with multi-molecule SERS examples in (j)–(o). Reprinted with permission from Titus (2013) © American Chemical Society.97.

Fig. 1