. 2024 Jan 17;16(7):3293–3323. doi: 10.1039/d3nr05332f

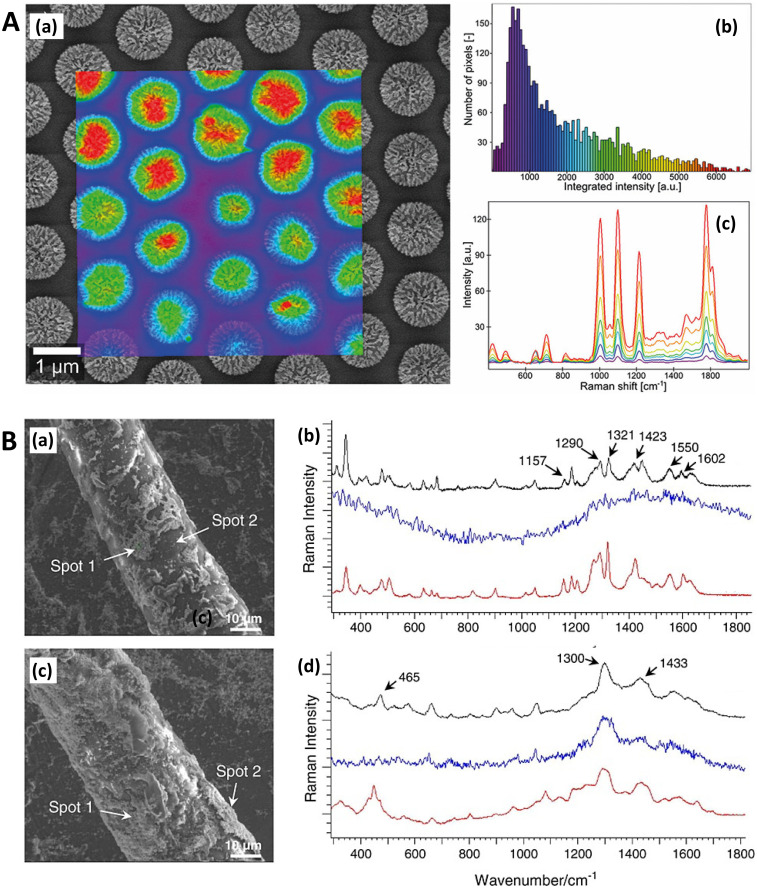
Fig. 3. Raman-SEM Correlative Imaging in SERS-active nanostructures. A. Raman-SEM correlative imaging (RISE) of nanocoral array. (a) SEM image (mixture of secondary and backscattered electron signal) overlaid with a false-color SERS map of the identical area, colors from violet to red correspond to different values of SERS intensity (from low to high, respectively) calculated as the area of 1215 cm−1 peak; (b) histogram of the integrated SERS intensities; (c) corresponding SERS spectra of 4-mercaptopyridine. Reprinted with permission from Štolcová (2015) © John Wiley and Sons.106 B. RISE of dyed fibers for SERS (a) SEM image of an alpaca fiber dyed with cochineal. (b) Stack of the SERS spectra measured in the SEM using the Structural and Chemical Analyzer (SCA) (Renishaw) on the spot 1 (black line) and 2 (blue line) shown in (a) and SERS spectrum of the reference sample of carminic acid obtained in the confocal optical microscope (red line). (c) SEM image of a wool fiber dyed with chay root. (d) Stack of the SERS spectra measured in the SEM using SCA on spot 1 (black line), and 2 (blue line) shown in (c) and SERS spectrum of the reference sample of alizarin obtained using the confocal optical microscope (red line). Reprinted with permission from Prikhodko (2015) © John Wiley and Sons.108.

Fig. 3