. 2024 Jan 17;16(7):3293–3323. doi: 10.1039/d3nr05332f

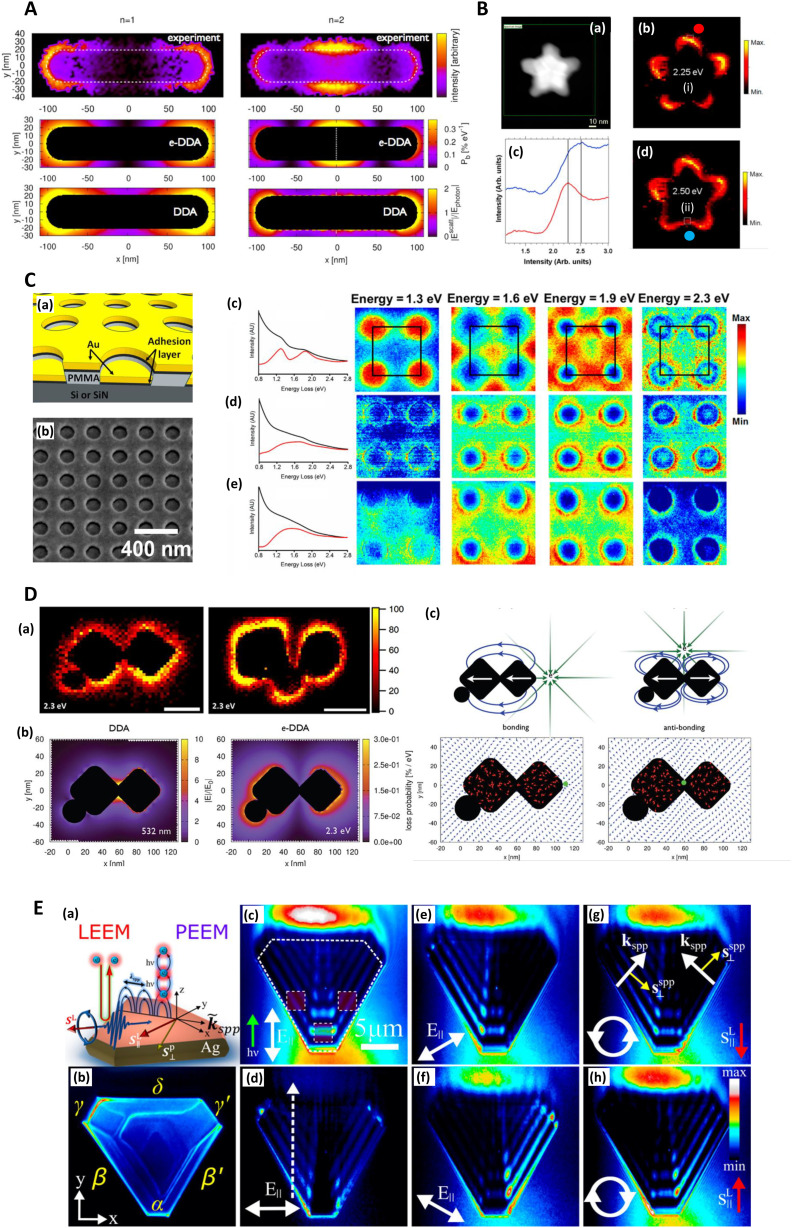
Fig. 4. Electron energy loss (EELS) and photoemission electron microscopy (PEEM) and SERS. A. EELS loss-probability maps of the two lowest-lying longitudinal plasmon modes of a silver nanorod supported on an amorphous SiNx substrate. n = 1 (1.50 eV) and n = 2 (2.61 eV) correspond to the first bright and dark plasmon modes of the monomer. The upper two panels display the experimentally measured loss-probability maps, adapted from Guiton (2011),233 while the middle two panels display the same observable computed via an electron-driven discrete dipole approximation (e-DDA). Each map indicates where in space the incident electron is likely to deposit the fraction ħω of its initial 0.1 MeV kinetic energy into a multipolar plasmon mode. The white dotted line in the middle right panel indicates the spatial location of the node of the first dark plasmon mode of the rod monomer. The lower two panels display the magnitudes of the corresponding electric fields scattered from the rod after excitation by a plane wave, computed via the DDA; these near-field magnitudes are taken in ratio to the magnitude of the incident plane wave, Ephoton. For the n = 1 mode, the incident field's direction of propagation (electric polarization) is normal (parallel) to the long axis of the rod. While for the n = 2 mode, the incident field propagation and polarization directions lie in the plane of the long axis of the rod and its normal but are tilted by ±45° with respect to the normal. This arrangement allows for light to couple into a mode of the rod that is dark under normal incidence. To symmetrize the n = 2 scattered electric field, we average together ±45-polarizations (see Guiton 2011233). It is clear that the loss-probability maps (upper four panels) and the photonic local density of states (see Fussell 2005234), which is related to the scattered electric field magnitude (Novotny 2006235) (bottom two panels), are not simply related to each other in this case (see Hohenester 2009;236 García de Abajo 2008237). Reprinted with permission from Bigelow (2012) © American Chemical Society & Guiton (2011) © American Chemical Society.156,233 B. EELS characterization of nanoshurikens for SERS. (a) High-angle annular dark-field (HAADF) scanning transmission electron microscopy (STEM) of a gold nanoshurken (AuNSh). EELS spectrum-imaging has been recorded in the square area marked in green. (b) and (d) Intensity maps extracted from the EELS spectrum-imaging after removing the zero-loss peak. The intensity maps show the spatial distribution of the two excited LSPR modes of the AuNSh, noted as (i) and (ii). (c) EELS spectra (each of them corresponds to the sum of 9 spectra) extracted from the EELS spectrum-imaging in the areas marked in each of the intensity maps (square regions) and marked as red dot (red line in (c)) and blue dot (blue line in (c)). Reprinted with permission from Morla-Folch (2014) © American Chemical Society.150 C. EELS of nanodisks for SERS with focus on plasmonic damping effect of adhesion layers. (a) Schematic diagram of the structures investigated. The thicknesses are 30 nm for Au, 2 nm for the adhesion layer, and ∼100 nm for polymethyl methacrylate (PMMA). (b) SEM of the actual structure. The sample is tilted to illustrate better the vertical offset between the gold nanodisks and the surrounding thin film. (c–e) Left: Spectra summed over the whole 500 × 500 nm region of interest before (black) and after (red) background subtraction of samples with (c) no adhesion layer, (d) 2 nm Ti, and (e) 2 nm Cr. Right: Normalized STEM-EELS energy slices generated from the three samples at energies 1.3, 1.6, 1.9, and 2.3 eV. Each slice is generated from a ± 0.05 eV range of the listed energy and normalized by total detector counts. The four nanodisks shown here are within a larger array, with the array unit cell outlined in black. In order of increasing energy, resonances appear in the sample with no adhesion layer (c) at unit cell corners, face centers, edge centers, and corners again. Samples with (d) Ti and (e) Cr adhesion layers do not show such localized high-intensity features. Reprinted with permission from Madsen (2017) © American Chemical Society.139 D. Spatially resolved EEL maps for single-molecule SERS (SMSERS)-active trimers. (a) Images (loss energy of 2.3 eV) have been normalized to the zero-loss peak (ZLP). A complete EEL spectrum is obtained for every pixel in the region of interest (defined by the annular dark field; however, focus is on the loss energy of 2.3 eV as this corresponds to the energy of the Raman laser (532 nm, 2.3 eV) used in the SMSERS experiment). While it is assumed that the largest electromagnetic enhancement is obtained at the gap region, no localization of the EEL intensity is observed in the gaps. Scale bars are 50 nm (left) and 100 nm (right). (b) Comparison of the calculated electric near-field magnitude obtained from plane-wave excitation (left) with the EEL probability map for a 100 keV electron beam (right) for a SMSERS-active trimer. Simulation of the plane-wave excitation is performed via the Discrete Dipole Approximation (DDA) at a wavelength of 532 nm. The wavevector of the excitation field is directed along the z-axis and is polarized along the x-axis. The 2D slice displayed corresponds to the plane where the electric-field magnitude is maximized. Other polarizations, wavevector directions, and projection planes were examined and show similar localization of the field in the junction regions. The loss-probability map, computed via a modified electron-driven DDA (e-DDA), is displayed at a corresponding loss-energy of 2.3 eV. In agreement with the experiment, the EEL map does not show an intense loss probability in the junction region. (c) Induced polarization maps (2.3 eV) obtained for two different positions of the electron beam (green bullet). Placement of the electron beam in the junction leads to a net antibonding arrangement of dipoles (right), whereas placement of the electron beam on the outside right corner leads to a net bonding arrangement (left). Also shown is the induced polarization (red vectors) and resulting scattered electric field (blue vectors), both normalized to unity to aid visualization. Both panels display 2D slices taken from fully 3D simulations of the trimer. The plane of visualization was chosen to lie at the height of the centroid of the two cubes. Reprinted with permission from Mirsaleh-Kohan (2012) © American Chemical Society.140 E. Low-energy electron microscopy (LEEM) and photoemission electron microscopy (PEEM) for plasmonic characterization of triangular Ag microstructures (a) Schematics of LEEM and multiphoton PEEM experiments. (b) Single photon PEEM image illuminated by UV lamp showing the Ag(111) crystal shape. The Greek letters label the island edges, where the dominant SPPs are coupled. In all experiments, the incident field k-vector is normal to the α edge. (c–h) Two-photon PEEM images showing beating patterns on the Ag crystal due to interference of the excitation light (λ = 460 nm) with SPPs. Dashed lines indicate the island geometry and regions of integration of the two-photon photoemission signal (c). The dashed arrow indicates the line along which the field interferences are considered (d). The excitation laser light is incident from the bottom at θ = 70° from the surface normal (green arrow) with linear (c–f) and circular (g and h) polarizations, which cause the asymmetric two-photon PEEM images in (e)–(h). The white arrows in (c)–(f) indicate projections of the linearly polarized incident light onto the surface plane. In (g) and (h) the white circulating arrows show the helicities of circularly polarized light; the red arrows, the corresponding in-plane directions of their spin angular momentums (SAMs); the white linear arrows, the k-vectors of SPPs; and the yellow arrows, their transverse SAMs. Reprinted with permission from Dai (2018) © American Chemical Society.160.

Fig. 4