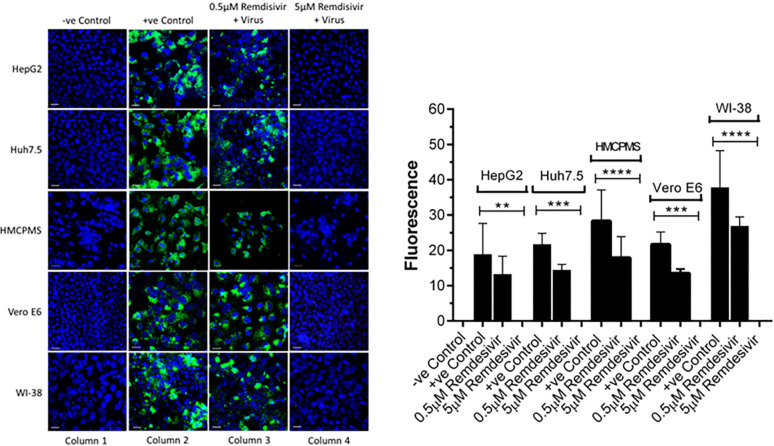
Figure 3.
Spike protein expression and quantification. Confluent (70%-80%) cells were preincubated with 0.5µM and 5µM remdesivir for 24 hours in a 12.5 mm polyester membrane transwell plate. Following incubation, the cells were infected with SARS-CoV-2 at MOI of 0.1 for 1 hour, washed with PBS (3X), and replaced with complete growth media. Infected cells were further incubated for 3 days and stained for SARS-CoV-2 spike protein expression levels (A) and quantified (B). Virus only was used as positive control and no virus as negative control. (B) The fluorescent signal was quantified using ImageJ software. Statistical analysis was performed using GraphPad Prism (version 9) software, using one-way ANOVA. **P = 0.0019, ***P = 0.0003, ****P = <0.0001. Fluorescent signal was captured using Zeiss LSM710 LIVE Duo confocal microscope. Bar indicates 20µm. n=3

