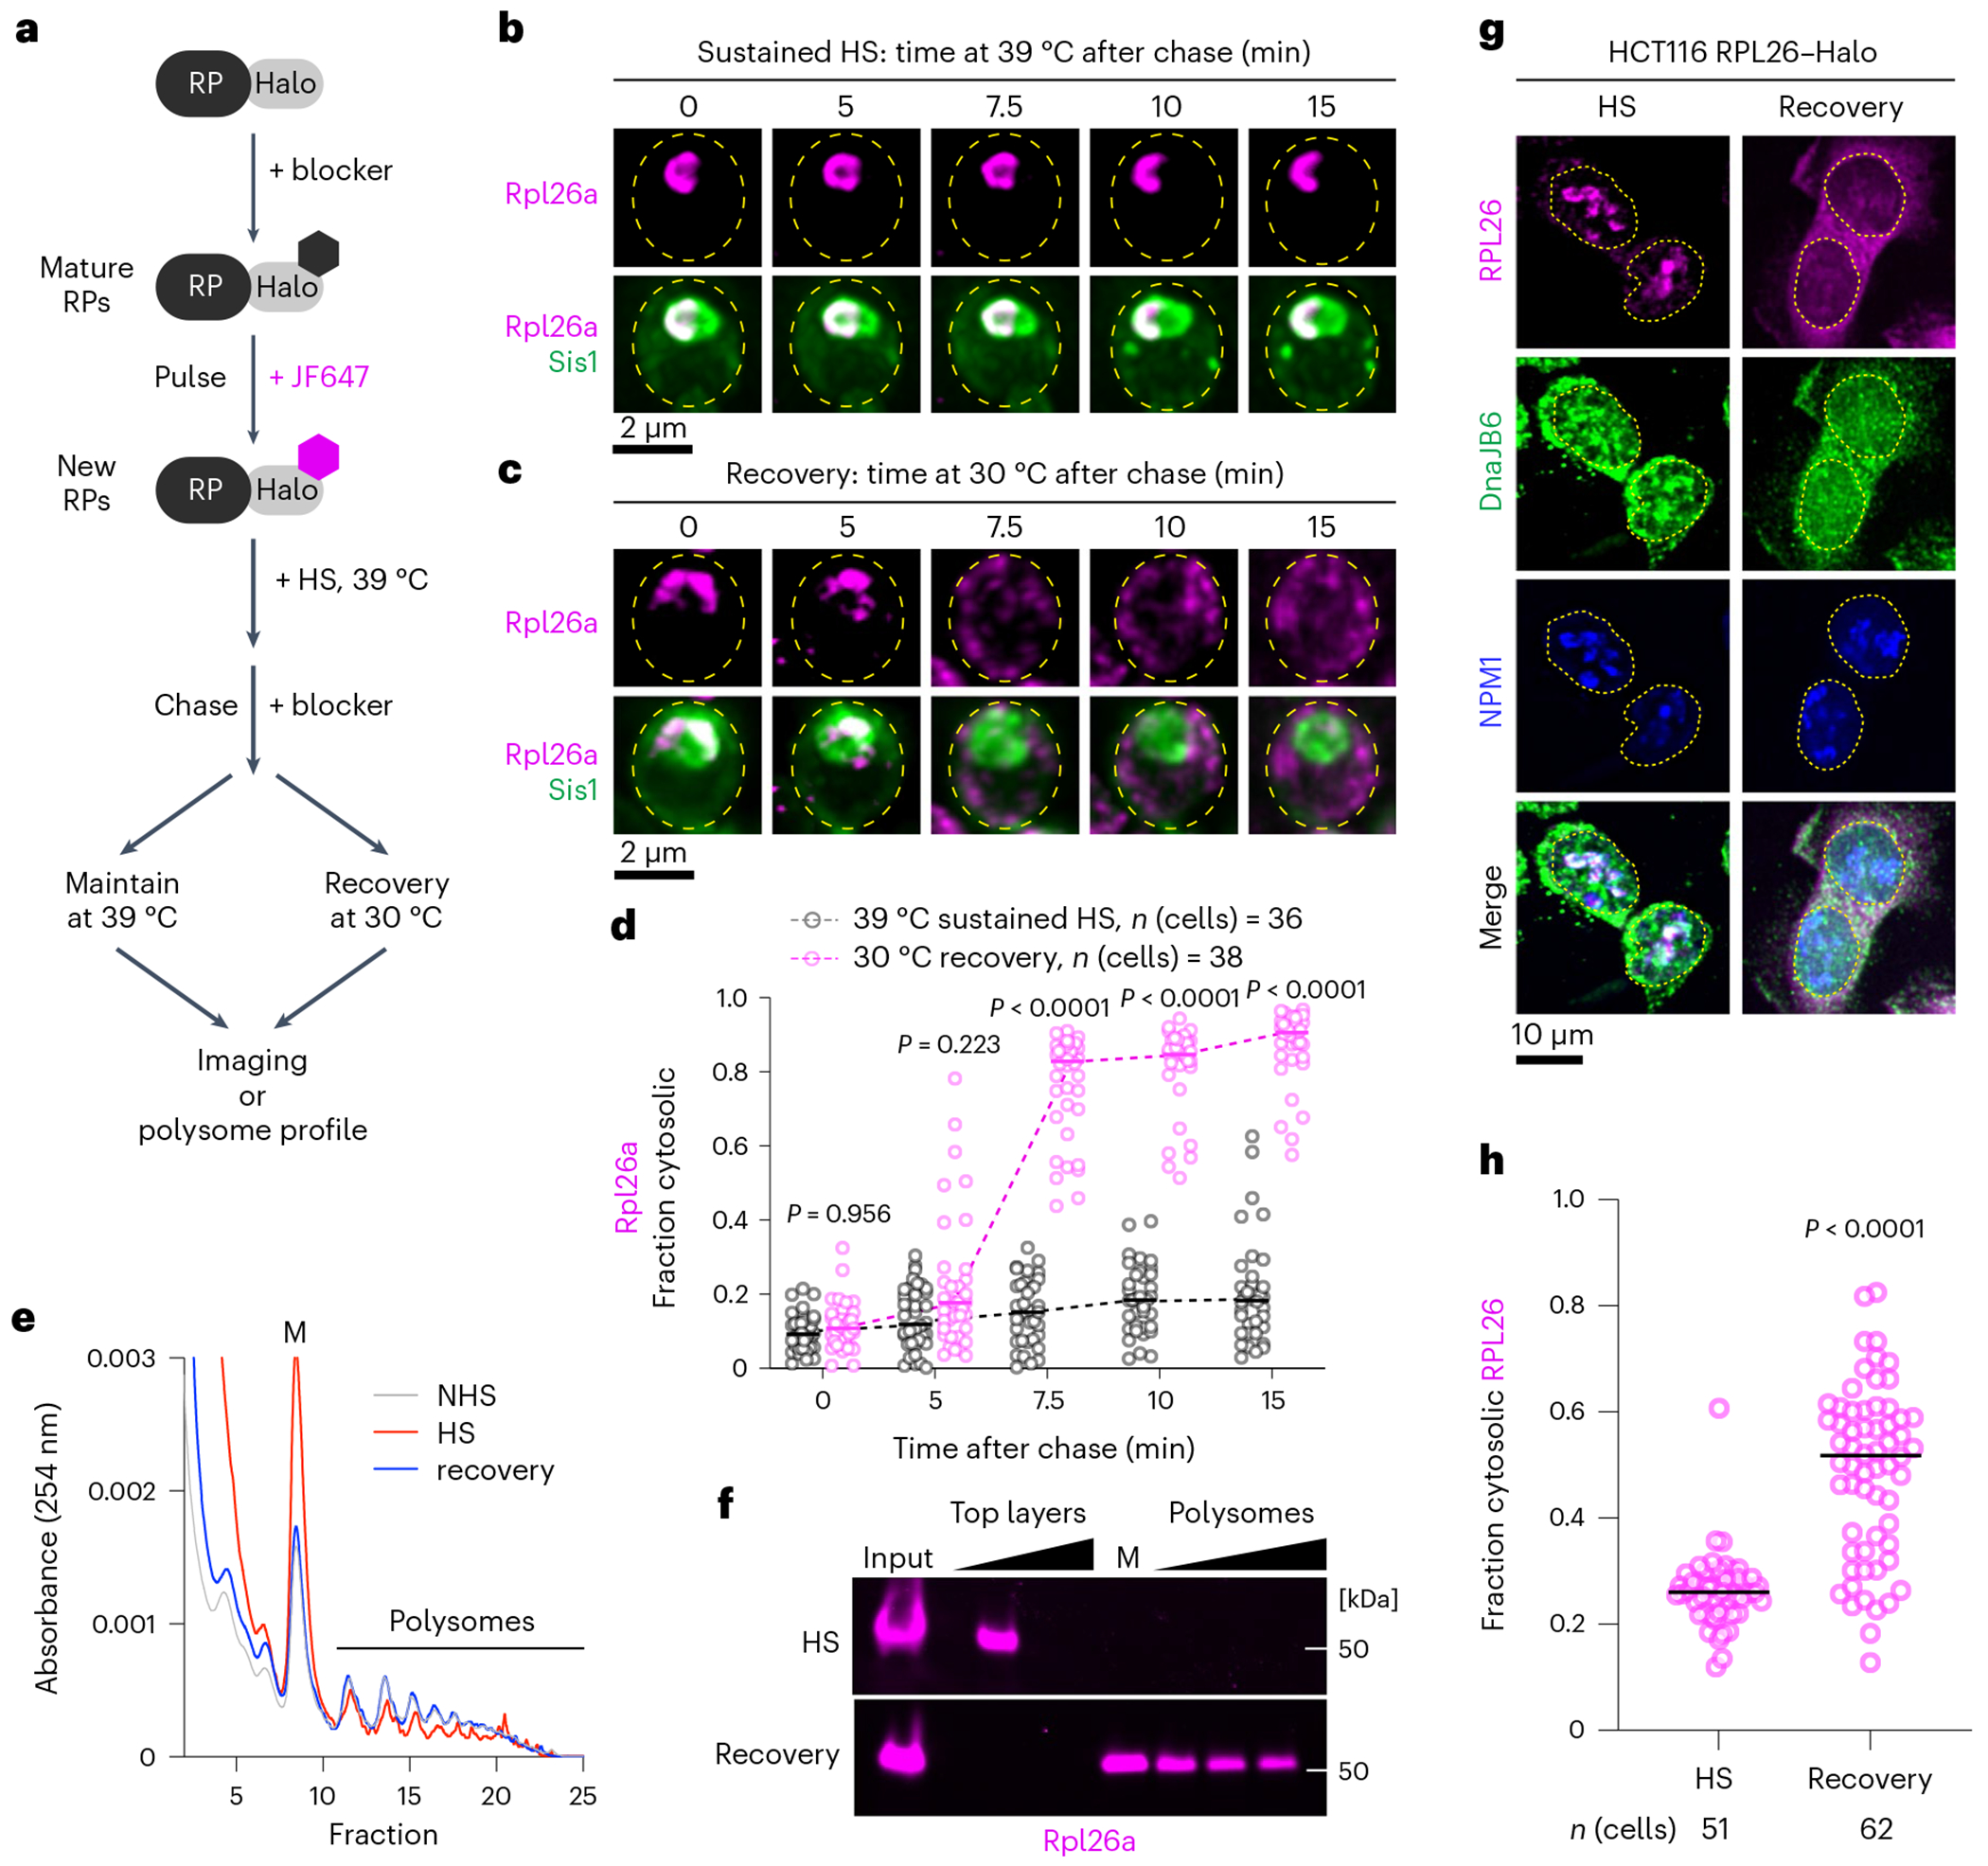
Fig. 5 |. oRP condensates are reversible upon recovery from heat shock.

a, Workflow to evaluate the fate of oRPs during sustained heat shock (HS) or recovery. b, Representative live-cell time lapse images of the spatial distribution of oRpl26a (magenta) and Sis1–mVenus (green) during sustained heat shock. c, As in b but following recovery from heat shock. d, Quantification of the fraction of cytosolic Rpl26a signal under sustained heat shock or recovery. Statistical significance was assessed using the Brown–Forsythe and Welch one-way ANOVA test, followed by Dunnett T3 multiple comparison tests. n indicates number of cells pooled from three biologically independent replicates. e, Polysome profiles of yeast expressing Rpl26a–Halo during non-stress, heat shock and recovery conditions. f, In-gel fluorescence of oRpl26a across the polysome profile in heat shock and recovery. g, Localization of oRPL26 (magenta) in HCT116 cells following heat shock and recovery. Cells were fixed and immunostained for DnaJB6 (green) and NPM1 (blue). h, Quantification of the fraction of cytosolic RPL26 in HCT116 cells under sustained heat shock or recovery. P values were calculated with unpaired two-tailed Welch’s t-test. n indicates number of cells pooled from three biologically independent replicates.
