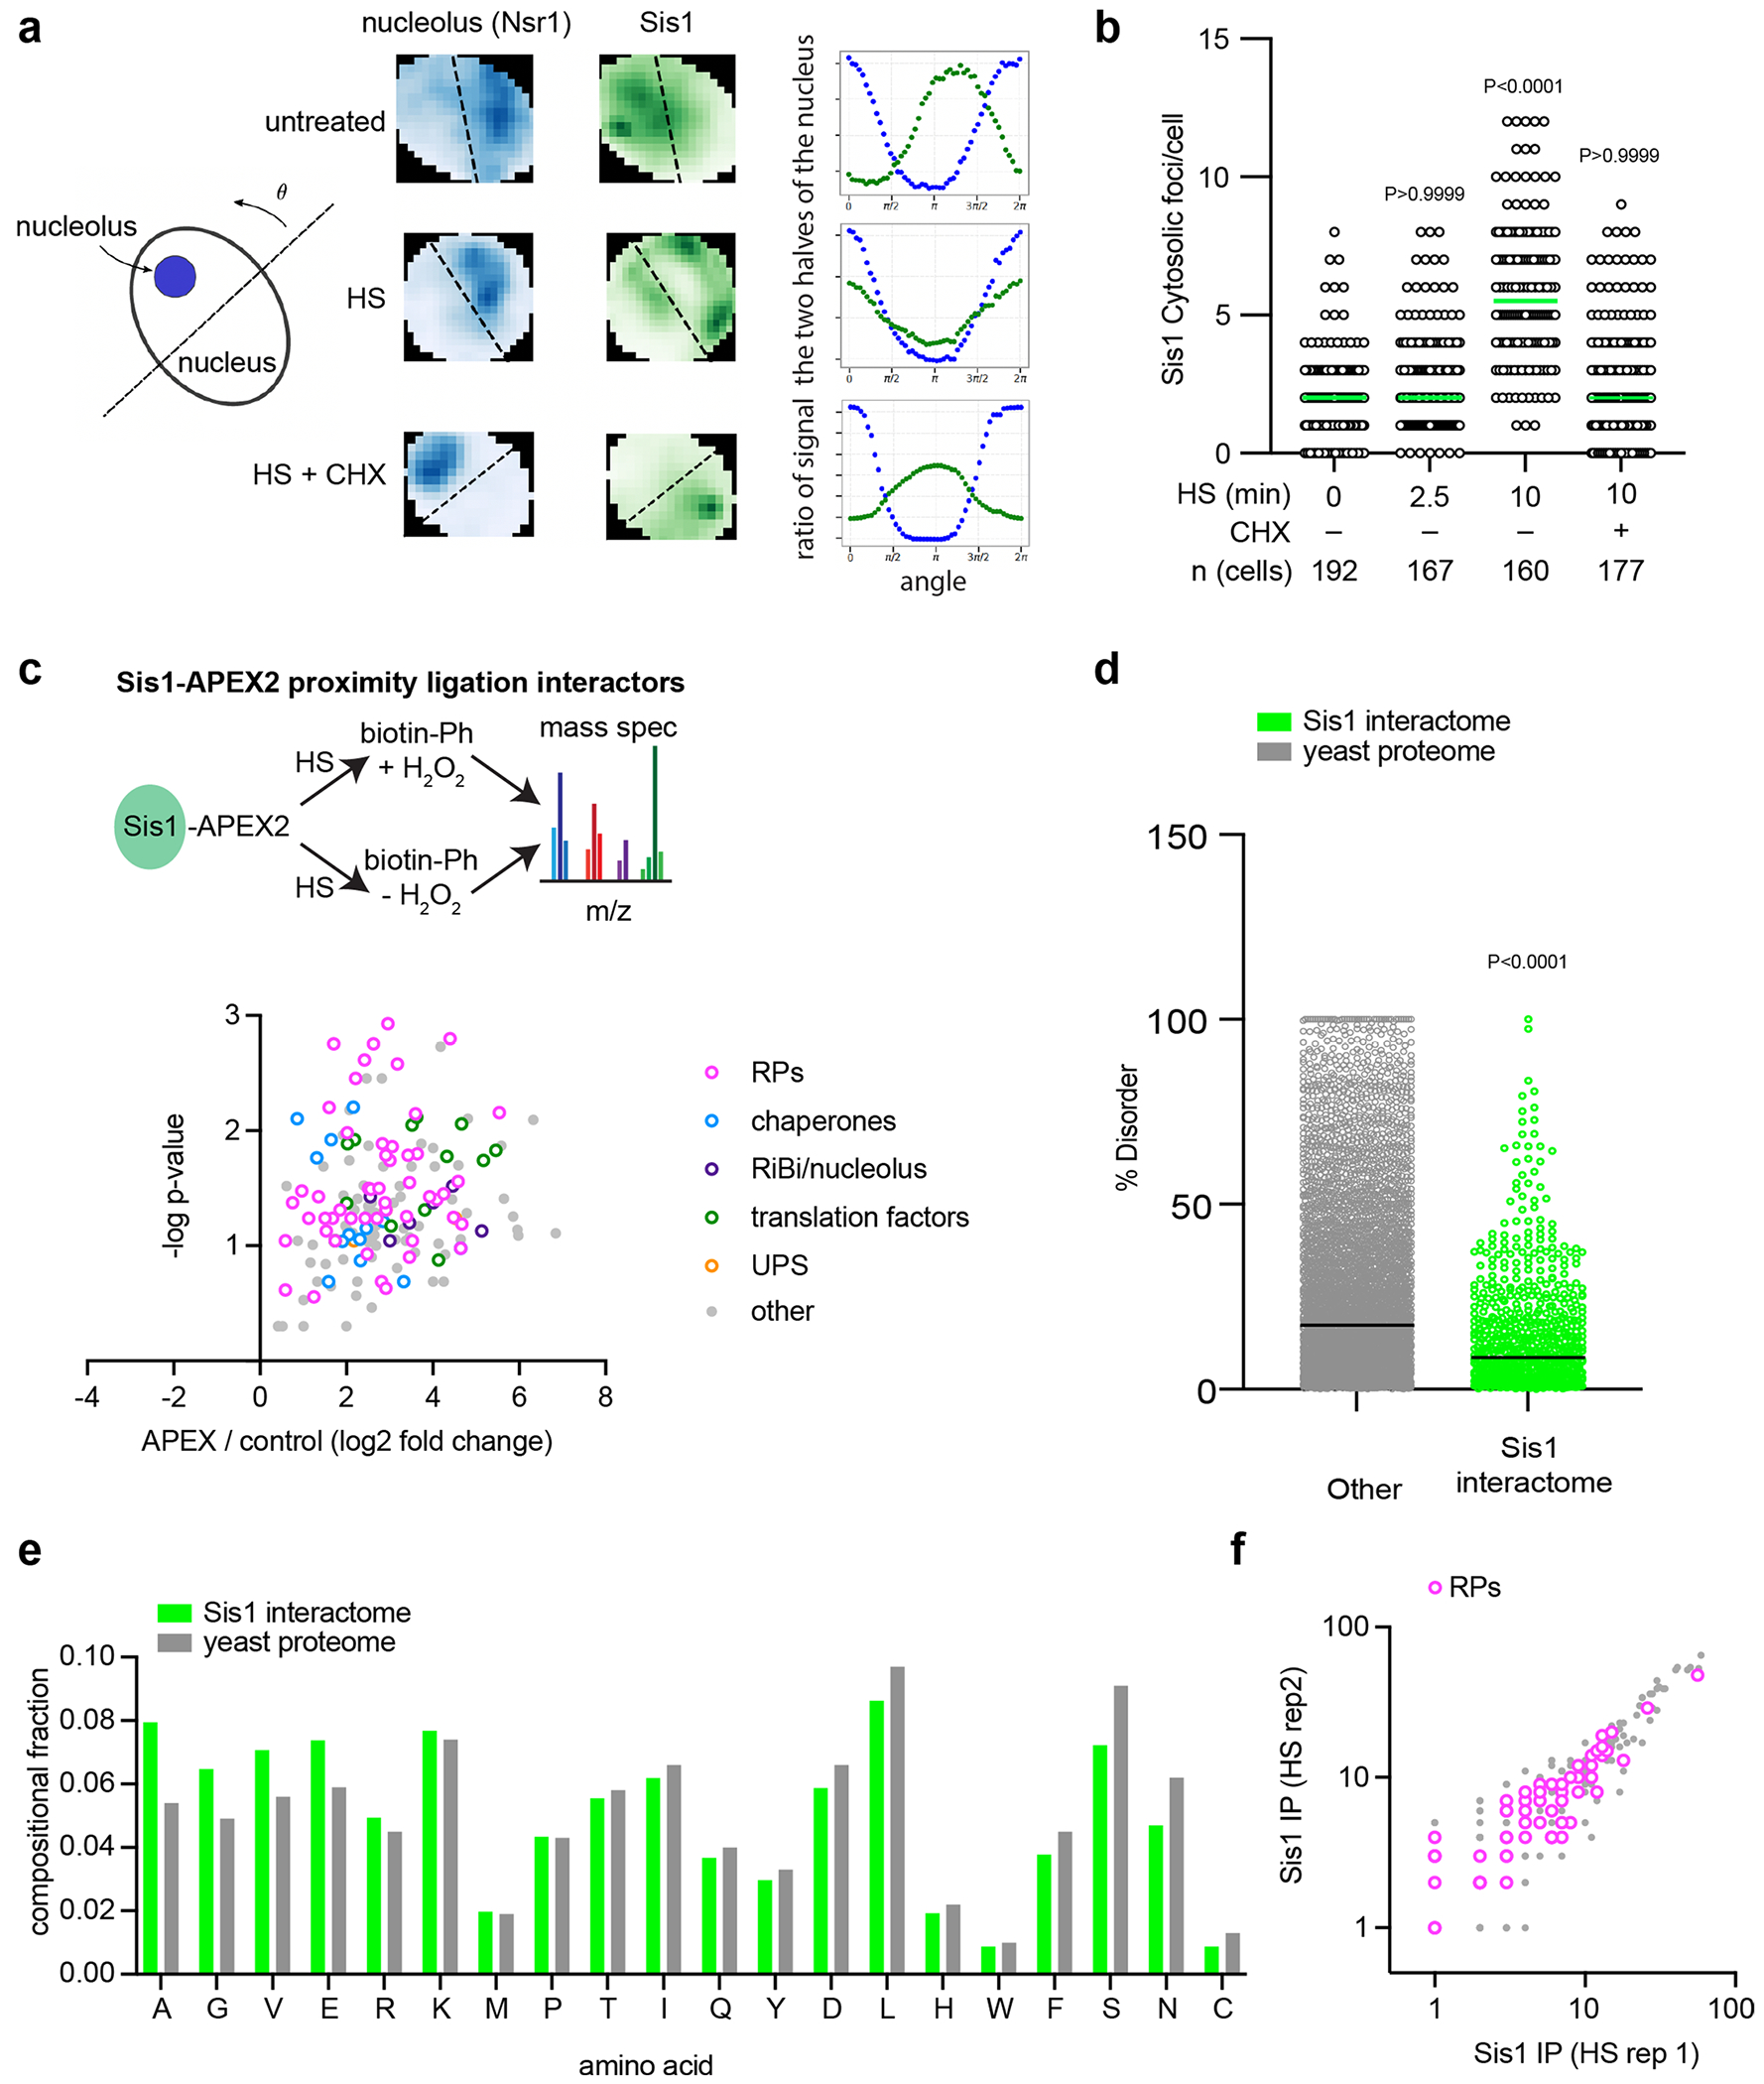
Extended Data Fig. 1 |. Sis1 localization and interactions during heat shock.

(a) Left: Schematic of how to bisect the nucleus with the nucleolus on one side by finding the line angle with the maximum difference in signal of the nucleolar marker in the two halves. Middle: Representative 2D projections of cells showing Nsr1 (blue) to mark the nucleolus and Sis1 (green). Line is set to maximize the difference in nucleolar signal and the ratio of Sis1 in the two halves is calculated. Right: Sis1 ratio as a function of the line angle rotated as depicted in the schematic to the left. (b) Quantification of Sis1 cytosolic foci per cell in the conditions listed. Foci were identified using the FindFoci plugin in ImageJ. Statistical significance was determined by Brown-Forsythe and Welch one-way ANOVA test followed by Games-Howell multiple comparison tests. n obtained from 3 independent experiment. (c) Volcano plot of Sis1-APEX2 interactors during heat shock. (d) Scatter plot showing the percentage of disorder in Sis1 interactors relative the whole proteome. P values were calculated with unpaired two-tailed Welch’s t-test. n = 2 biological replicates. Each dot symbolizes individual proteins, with ‘n’ representing 5151 proteins for the entire yeast proteome and 731 proteins for the Sis1 interactors induced by heat shock. Data is representative of 2 biologically independent experiments. (e) Bar plots representing the amino acid sequences enrichment of the Sis1 interactors compared to the yeast proteome. Data is representative of 2 biologically independent experiments. (f) Biological replicates of Sis1-3xFlag IP interactors.
