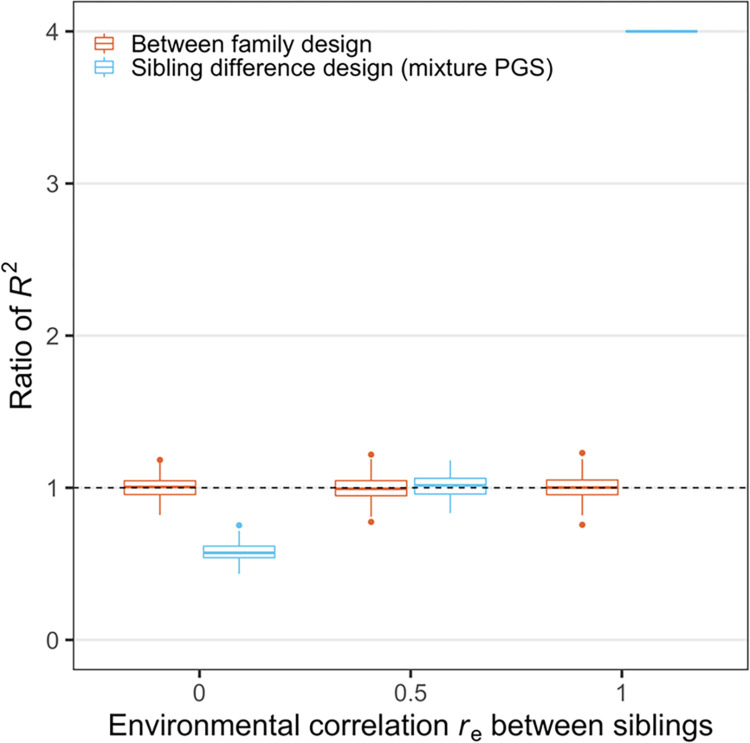
Fig 1. The effect of environmental correlation re between siblings on the R2 of PGS regression analyses from different study designs.
y-axis shows the ratio of R2 from between family design (red) or sibling difference design (blue) vs. the proportion of phenotypic variance due to the direct effect in the population. Each boxplot shows the simulation results of 200 repeats. In each repeat, we simulated the true SNP effect sizes (βdir and βind) from a bivariate normal distribution, and the environmental effect sizes for siblings from a bivariate normal distribution. We then calculated the phenotype, PGS, and run the linear regression analyses. In this figure, the PGS was calculated using (βdir+βind). The variance of direct effect size and the variance of the environmental effect size were fixed at 1 and 3, respectively. The indirect effect size and the correlation rg between direct and indirect effect were both set to 0. When re = 1, the environmental terms for two siblings become identical, thus their phenotypic difference becomes ΔPGSdir and their PGS difference is also ΔPGSdir since here we set βind = 0. Thus, its R2 is always 1 in each repeat whereas the proportion of the phenotypic variance by the direct effect is ¼. Therefore, the ratio is always 4 for the last setting as shown in the figure.

