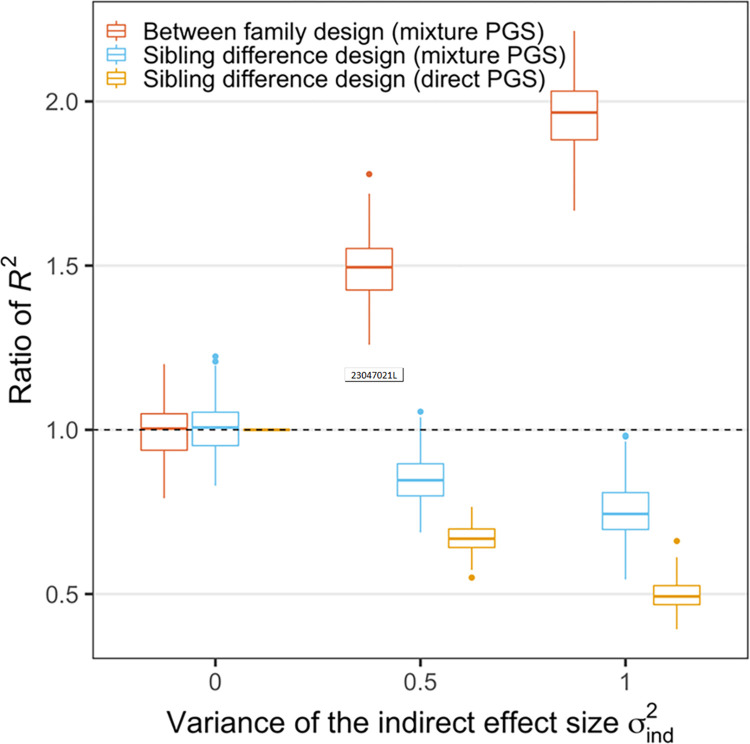
Fig 2. The effect of indirect effect size variance on the R2 of PGS regression analyses from different study designs.
y-axis shows the ratio of R2 from between family design (red) or sibling difference design (blue) vs. the proportion of phenotypic variance due to the direct effect in the population. The yellow box shows the ratio of R2 from the sibling difference design based on PGSmix vs. that in a sibling difference design based on PGSdir. Each boxplot shows the simulation results of 200 repeats. In this figure, the variance of direct effect size and the variance of the environment effect size were fixed at 1 and 3, respectively. The correlation rg between direct and indirect effect sizes and the correlation re between two sibling’s environments were fixed at 0 and 0.5, respectively. When the indirect effect is 0 (both and βind are 0), the sibling difference analyses become identical regardless of whether the PGS is computed based on (βdir+βind) or βdir, thus the yellow box is fixed at 1 when in this figure.

